Fig. 9
Download original image
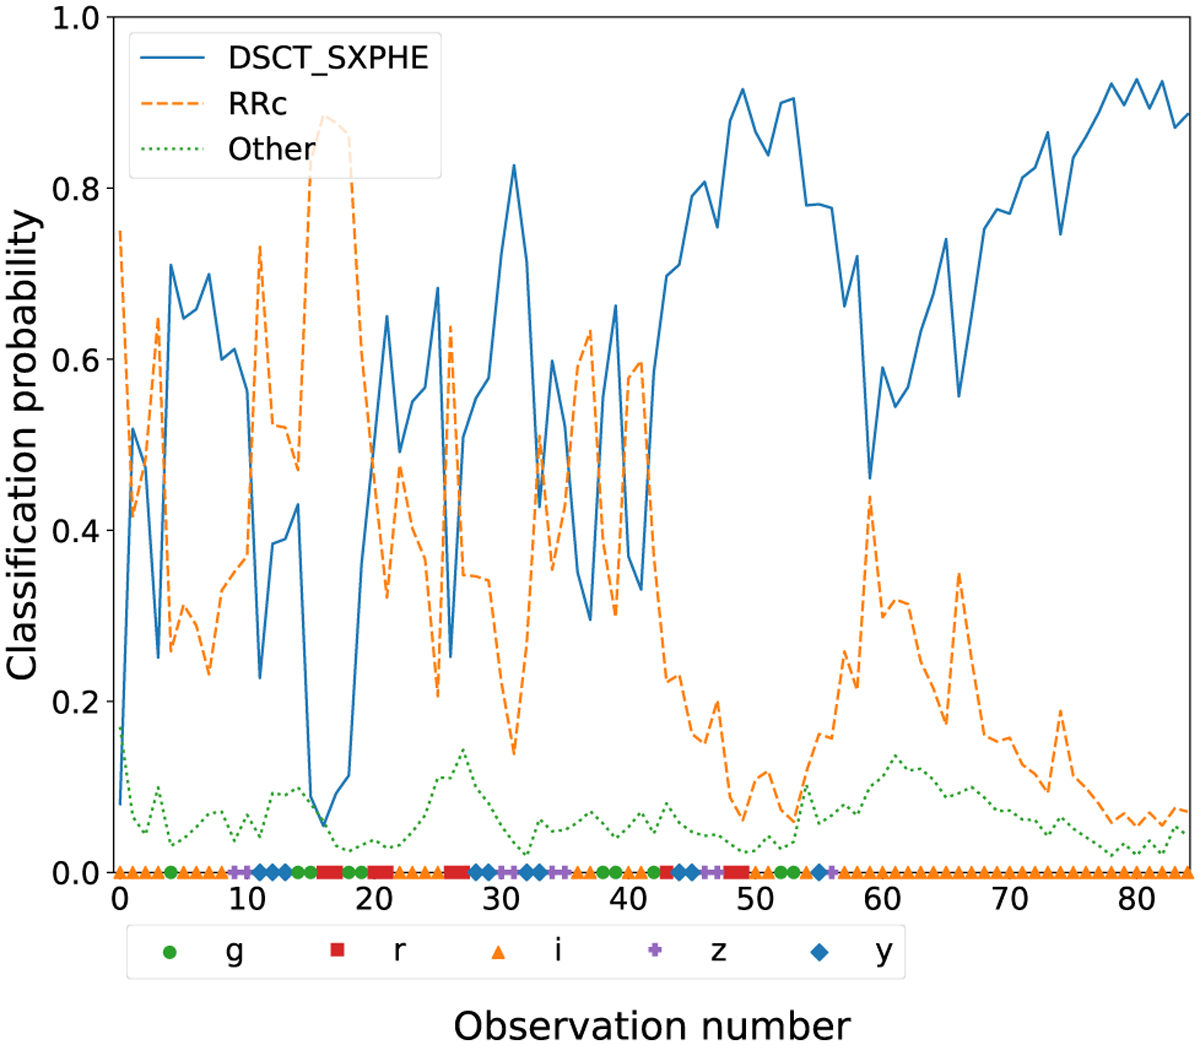
Example of the models’ output of the classification probabilities as a function of the number of observations for the Pan-STARRS1 DSCT_SXPHE star 86363087019643005. The symbols on the lower axis identify the filters used for each observation. Filter g is represented with a green circle, r with a red square, i with an orange triangle, z with a purple cross, and y with a blue diamond. The model’s main confusion was among DSCT_SXPHE (blue solid line) and the RRc class (orange dashed line). The rest of the classes, represented as Other (green dotted line) are assigned a low probability.
Current usage metrics show cumulative count of Article Views (full-text article views including HTML views, PDF and ePub downloads, according to the available data) and Abstracts Views on Vision4Press platform.
Data correspond to usage on the plateform after 2015. The current usage metrics is available 48-96 hours after online publication and is updated daily on week days.
Initial download of the metrics may take a while.