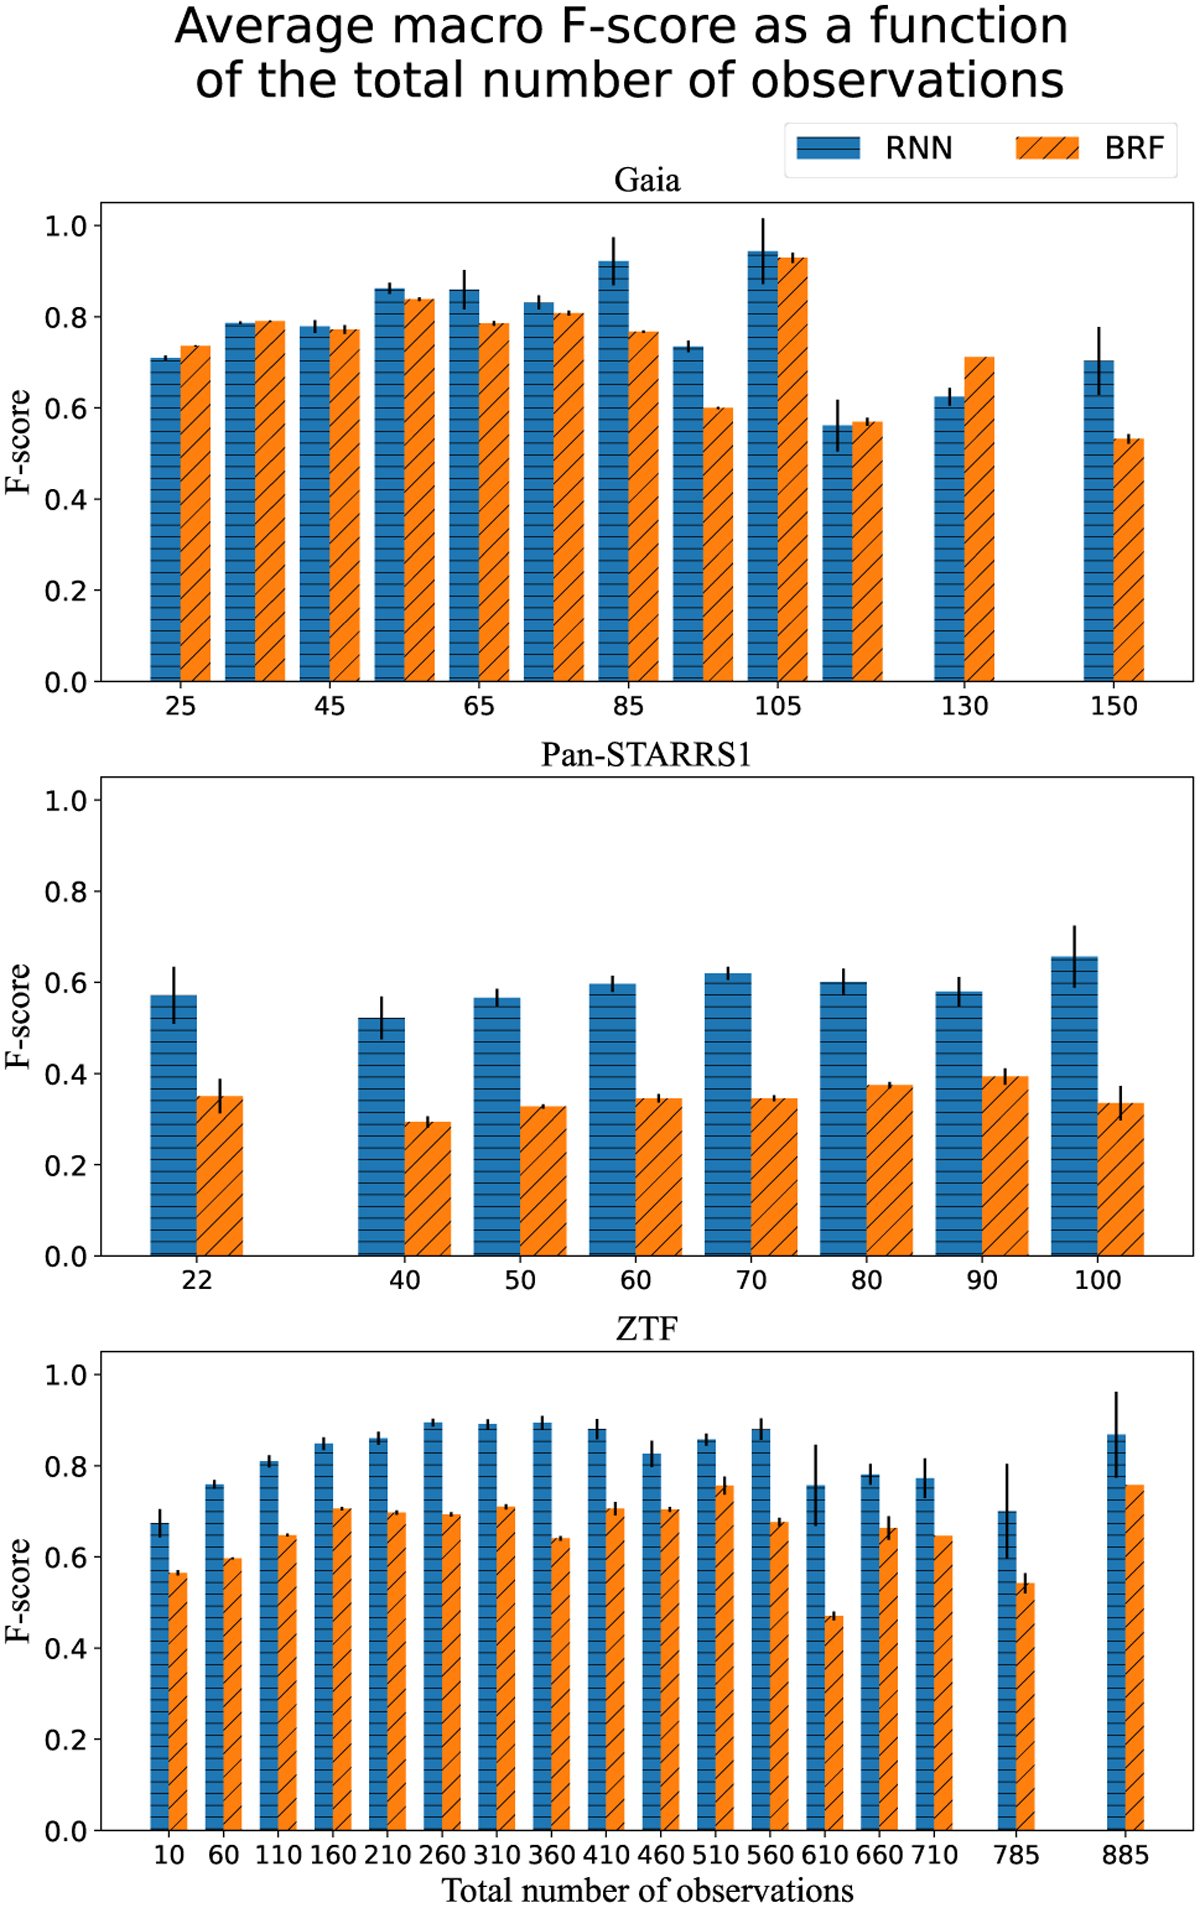
Fig. 10
Download original image
F-score as a function of the total number of observations. The results of the RNN model are shown in solid blue, while the values for the BRF are shown in diagonal hatched orange. The bins are not uniform as some of them were merged to increase the number of objects per bin. Bins with less than 20 examples were removed to avoid showing unrepresentative results. The vertical black lines show the standard deviation for each bin.
Current usage metrics show cumulative count of Article Views (full-text article views including HTML views, PDF and ePub downloads, according to the available data) and Abstracts Views on Vision4Press platform.
Data correspond to usage on the plateform after 2015. The current usage metrics is available 48-96 hours after online publication and is updated daily on week days.
Initial download of the metrics may take a while.