Open Access
Fig. 2.
Download original image
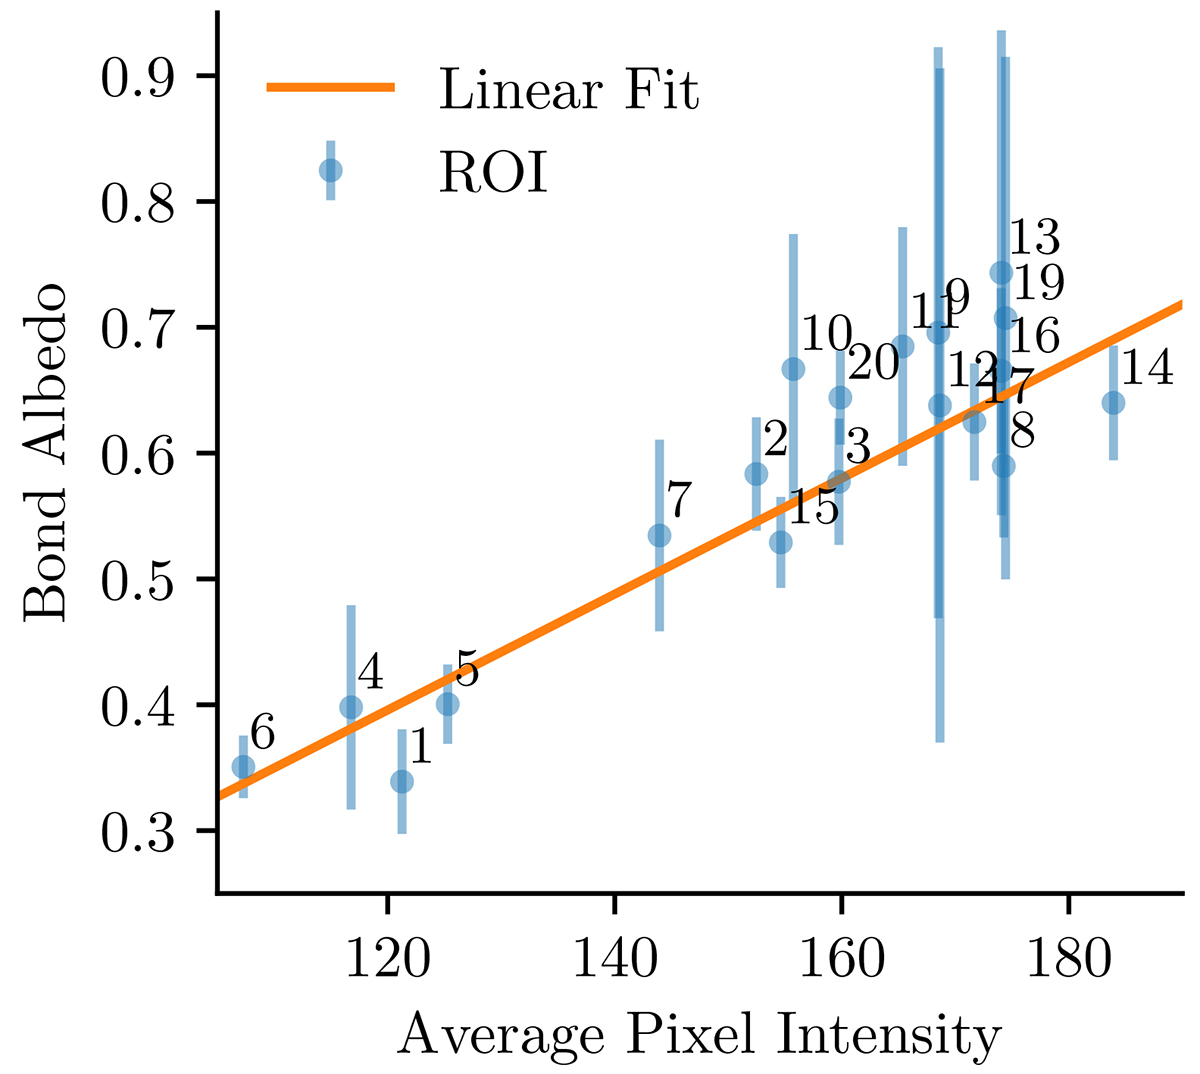
Correlation between Bond albedo and pixel intensity on the USGS map. Each dot represents a ROI, where the mean Bond albedo and its uncertainty were derived from photometric measurements and the average pixel intensity of the corresponding region was calculated.
Current usage metrics show cumulative count of Article Views (full-text article views including HTML views, PDF and ePub downloads, according to the available data) and Abstracts Views on Vision4Press platform.
Data correspond to usage on the plateform after 2015. The current usage metrics is available 48-96 hours after online publication and is updated daily on week days.
Initial download of the metrics may take a while.