Open Access
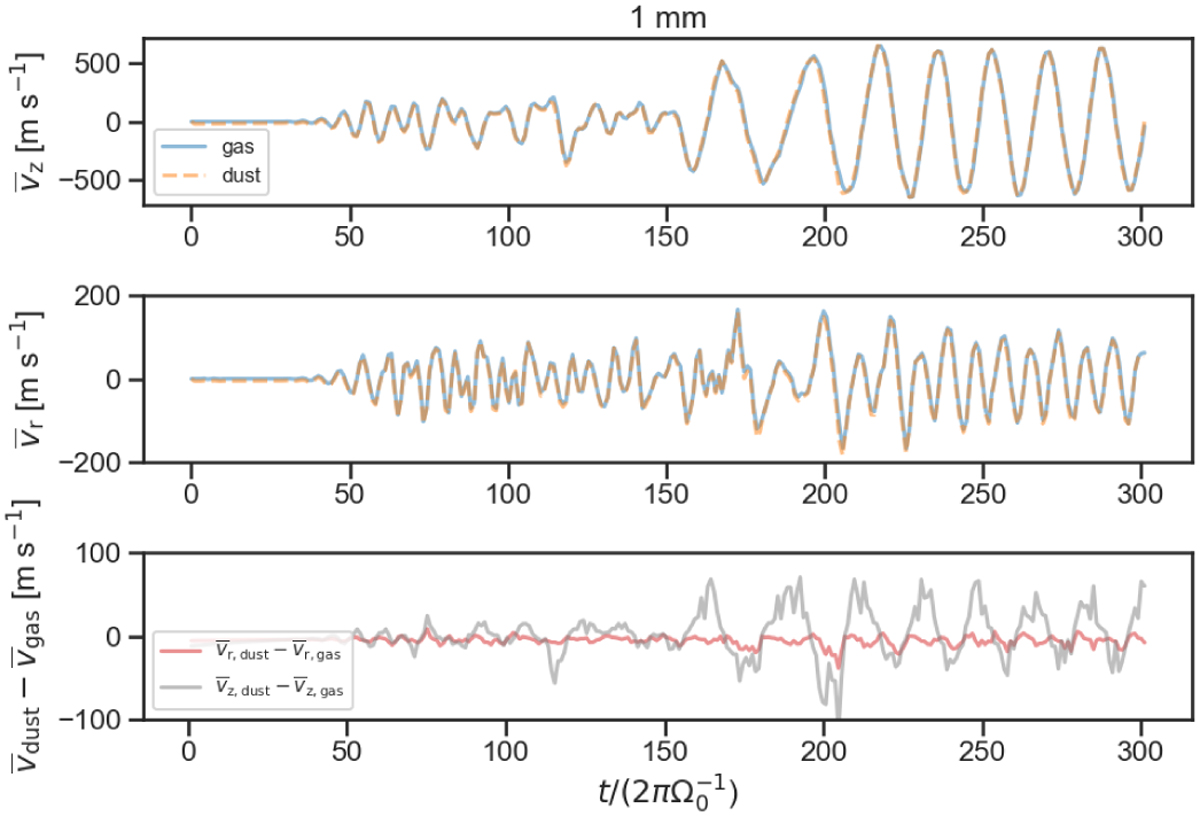
Fig. 6
Download original image
Velocity profiles of the particles. Top and middle: time evolution of the mean vertical and radial velocity of a swarm of 1 mm particles around the midplane. Bottom: mean difference between the vertical dust and gas velocity (top panel) in gray, and the radial dust and gas velocity (middle panel) in light red.
Current usage metrics show cumulative count of Article Views (full-text article views including HTML views, PDF and ePub downloads, according to the available data) and Abstracts Views on Vision4Press platform.
Data correspond to usage on the plateform after 2015. The current usage metrics is available 48-96 hours after online publication and is updated daily on week days.
Initial download of the metrics may take a while.