Fig. 4
Download original image
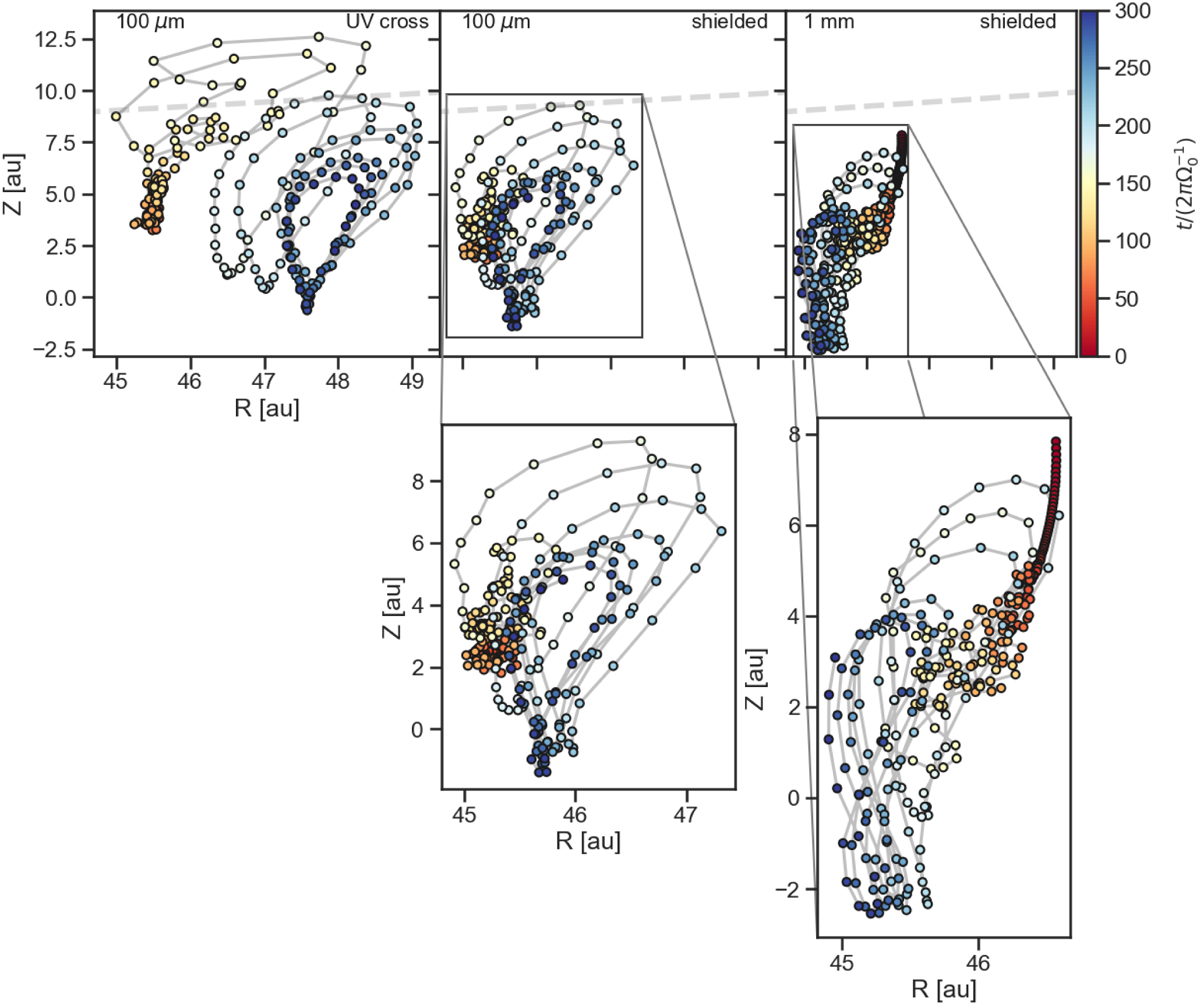
Spatial distribution of the dynamical trajectory for three different particles. The top panels show the track of the particles and the colorbar represents the dynamical evolution in orbits. The dashed gray line marks the elevation of Z/R = 0.2, our definition of the bottom-most UV layer. The top left and top middle panels show the dynamical trajectory of two 100 µm size particles, one showing that it crosses the Z/R = 0.2 during the saturation phase of the VSI after ~100 orbits, and the other being shielded from UV radiation all the dynamical evolution of the disk. The top right panel shows the trajectory for a 1 mm particle being shielded in the disk all the time. Our results show that no 1 mm particle crosses Z/R = 0.2. At the beginning of the simulation, all the particles experience dust settling toward the midplane and inward radial drift. After ~40 orbits, VSI induces diffusion in the radial and vertical motion of the particles.
Current usage metrics show cumulative count of Article Views (full-text article views including HTML views, PDF and ePub downloads, according to the available data) and Abstracts Views on Vision4Press platform.
Data correspond to usage on the plateform after 2015. The current usage metrics is available 48-96 hours after online publication and is updated daily on week days.
Initial download of the metrics may take a while.