Open Access
Fig. 3
Download original image
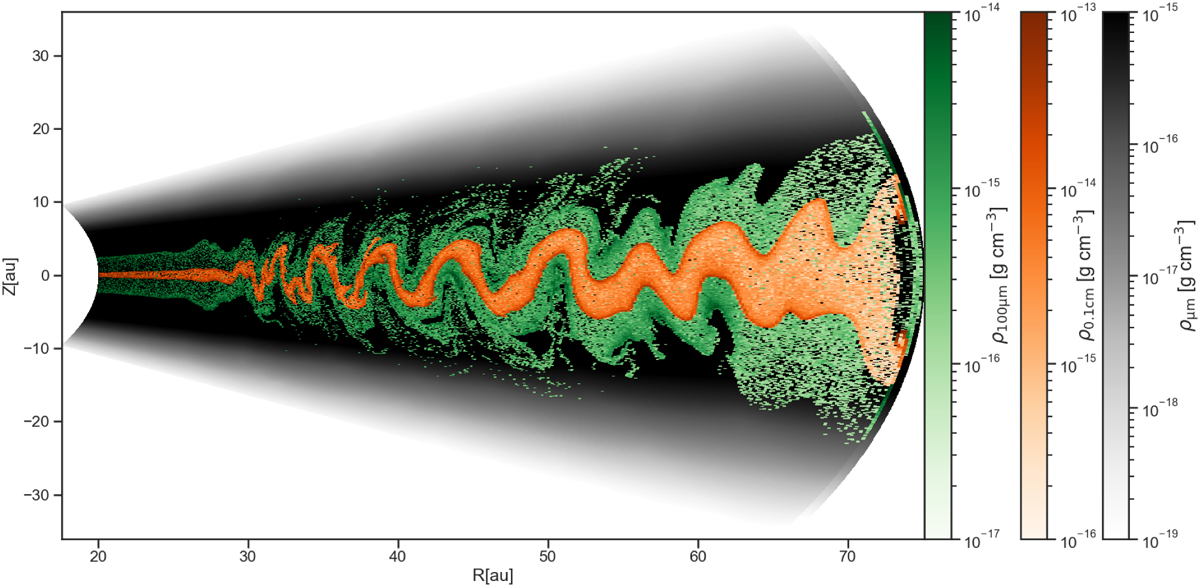
Dust density distribution of our model at 200 orbits. The large grains are 100 µm (green) and 1 mm (orange). The small grains spanning from 0.1 to 30 µm is plotted as a black shade in the disk and are assumed to be well coupled with the gas.
Current usage metrics show cumulative count of Article Views (full-text article views including HTML views, PDF and ePub downloads, according to the available data) and Abstracts Views on Vision4Press platform.
Data correspond to usage on the plateform after 2015. The current usage metrics is available 48-96 hours after online publication and is updated daily on week days.
Initial download of the metrics may take a while.