Open Access
Fig. C.1
Download original image
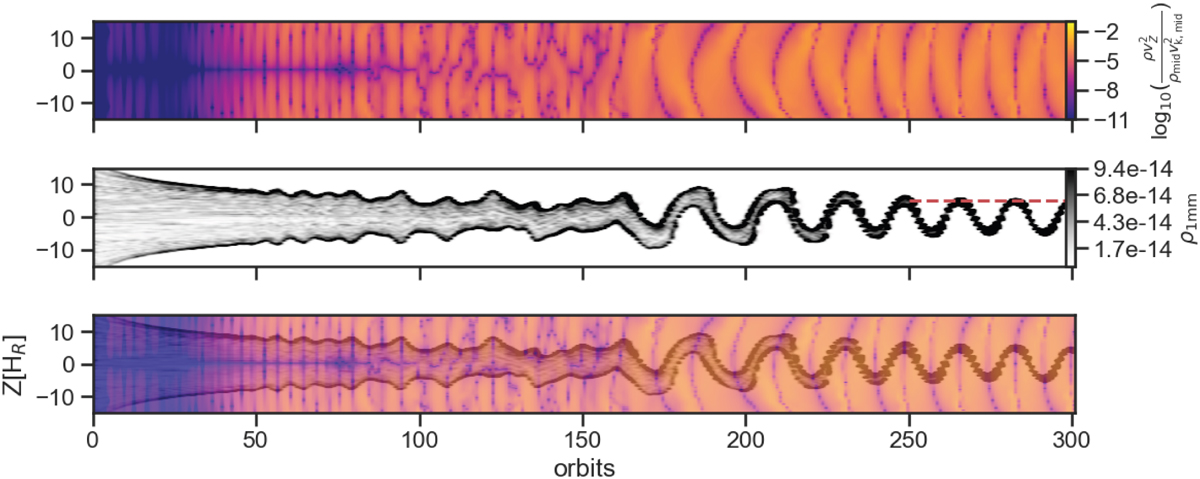
Time evolution of the local kinetic energy (top) and local 1 mm dust distribution (middle) at 50 au. The red dashed line at Z = 5 HR represent the height when particles reach equilibrium with the gas. The bottom panel shows the middle panel overplotted on the top panel.
Current usage metrics show cumulative count of Article Views (full-text article views including HTML views, PDF and ePub downloads, according to the available data) and Abstracts Views on Vision4Press platform.
Data correspond to usage on the plateform after 2015. The current usage metrics is available 48-96 hours after online publication and is updated daily on week days.
Initial download of the metrics may take a while.