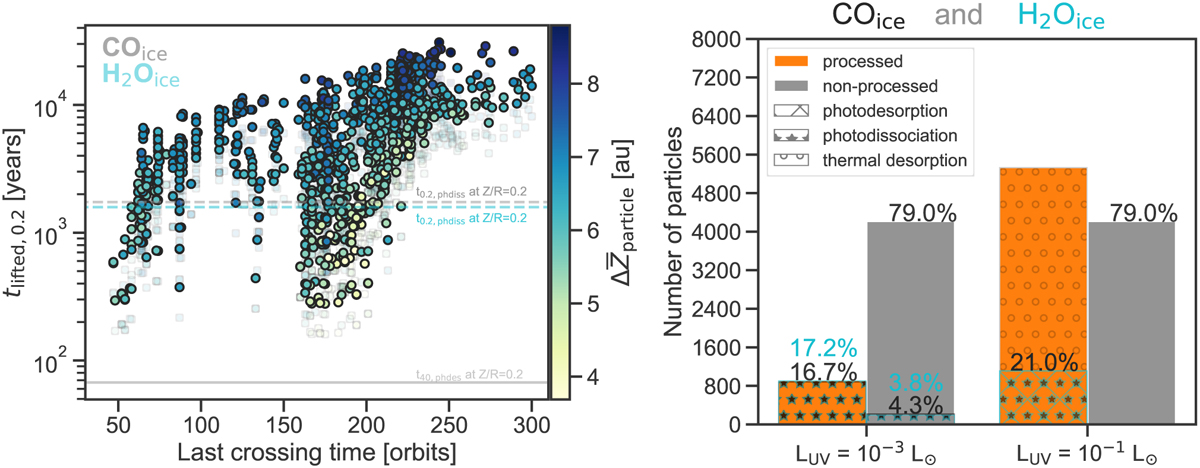
Fig. 11
Download original image
Particle processing timescales, tlifted,0.2. Left: tlifted,0.2 compared to the orbital timescales of the 100 µm particles that cross the Z/R = 0.2 layer. The x-axis represents the last crossing time in simulation orbit when the particle last crossed the Z/R = 0.2. The horizontal dashed and solid lines represent the CO ice (gray) and H2O ice (light blue) photoprocessing timescale at Z/R = 0.2 for the low-luminosity case and the photodesorption timescale at Z/R = 0.2 for the high-luminosity test case. Particles above these photodestruction timescales are subject to ice processing. The other photodestruction timescales at Z/R = 0.2 lie outside the tlifted,0.2 range shown in this plot. The colorbar represents the total distance traveled by the 100 µm particles, where the mean total distance peaks around 5.4 au. Right: Bar plot showing the distribution of particles processed by thermal or photochemical processes vs. those that remain unprocessed despite crossing the Z/R = 0.2 layer, for both stellar luminosity cases. The sample size comprises 1 mm and 100 µm particles. In the low-luminosity scenario, 16.6 and 17.2% of the crossing particles (all 100 µm particles) undergo CO ice and H2O processing via photodissociation, respectively. Only 4.3 and 3.8% do not experience photoprocessing despite having crossed the Z/R = 0.2 layer, and are added to the non-processed category, which already includes 79% of the UV-shielded particles. For the high-luminosity case, thermal photodesorption affects all particles across all disk radii and vertical layers, whereas for photodesorption and photodissociation processes it is slightly higher than for the low-luminosity case.
Current usage metrics show cumulative count of Article Views (full-text article views including HTML views, PDF and ePub downloads, according to the available data) and Abstracts Views on Vision4Press platform.
Data correspond to usage on the plateform after 2015. The current usage metrics is available 48-96 hours after online publication and is updated daily on week days.
Initial download of the metrics may take a while.