Fig. 3.
Download original image
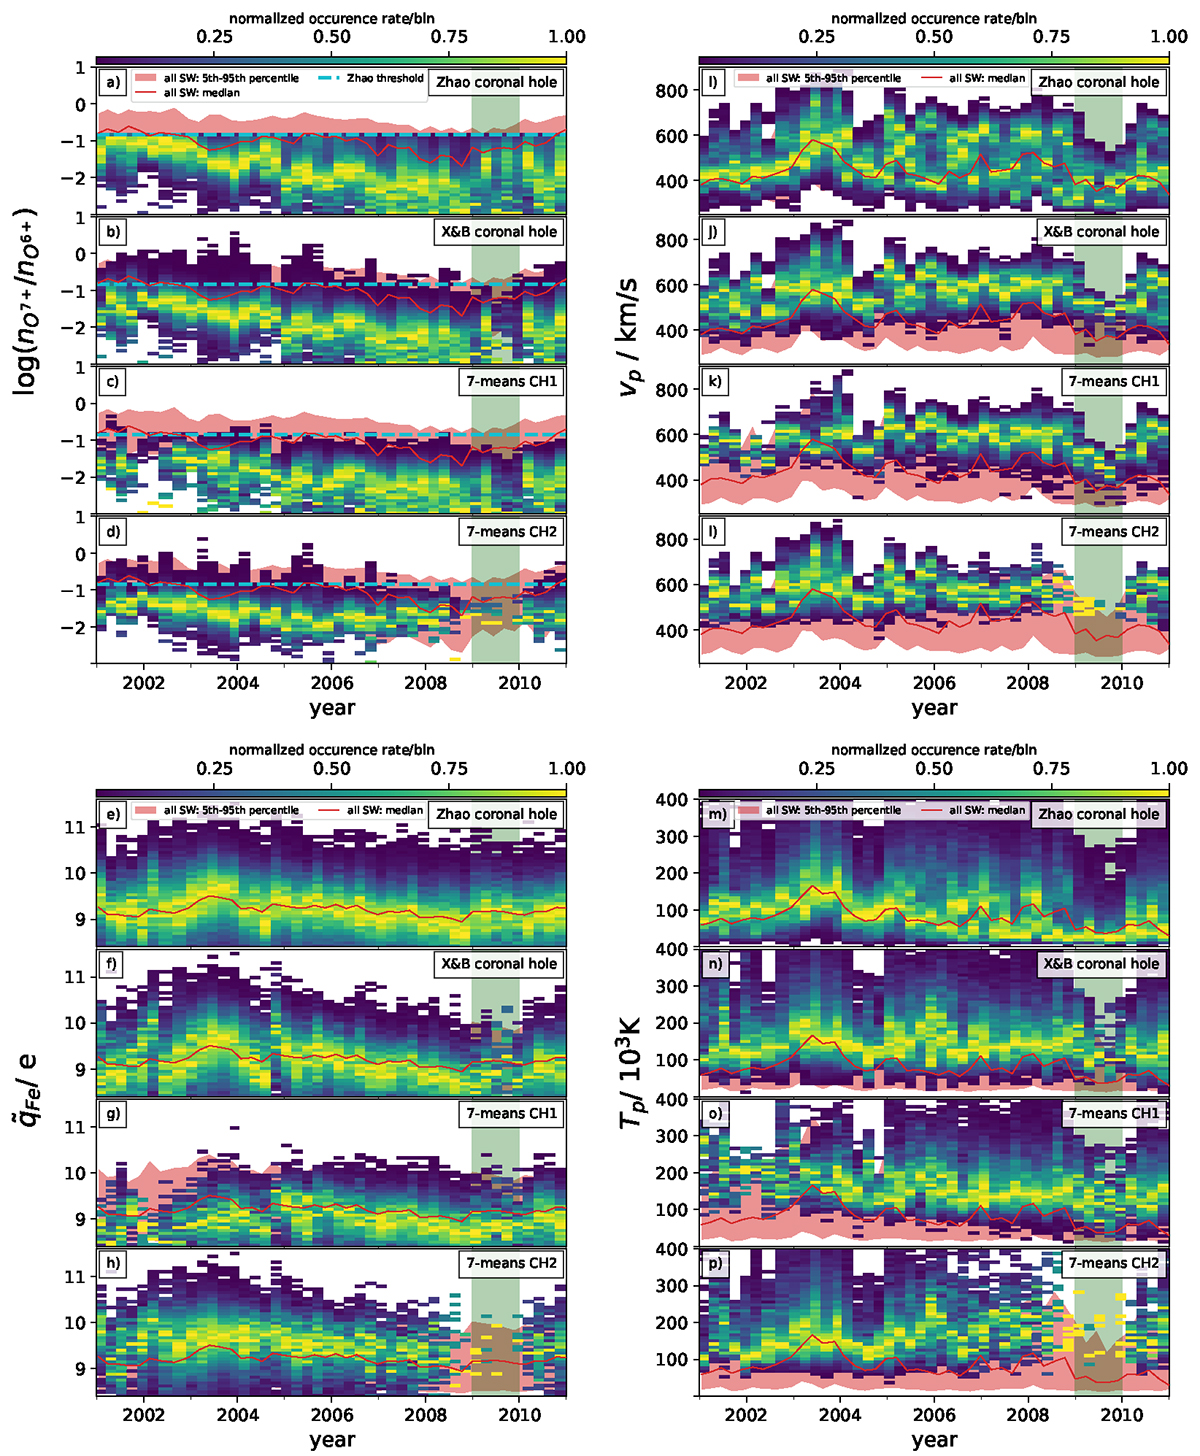
1D histograms of solar wind properties over time. Each 1D histogram represents three consecutive Carrington rotations. ![]() in the top left (panels (a)–(d)),
in the top left (panels (a)–(d)), ![]() in the top right (panels (e)–(h)), vp in the bottom left (panels (i)–(l)), Tp in the bottom right (panels (m)–(p)). In each panel, each column is normalized to its own maximum. In each panel, the red line indicates the respective median for all solar wind observations, and a red shading estimates the range of all solar wind observations in each Carrington rotation from the 5th to 95th percentile. Each panel shows the respective histograms for each of the four coronal hole wind types of interest. From top to bottom: Zhao et al. (2009) coronal hole, Xu & Borovsky (2015) coronal hole, 7-means CH1, and 7-means CH2. In panels (a)–(d), the decision threshold from Zhao et al. (2009) is indicated with a dashed horizontal cyan line. Green shading in all panels highlights 2009.
in the top right (panels (e)–(h)), vp in the bottom left (panels (i)–(l)), Tp in the bottom right (panels (m)–(p)). In each panel, each column is normalized to its own maximum. In each panel, the red line indicates the respective median for all solar wind observations, and a red shading estimates the range of all solar wind observations in each Carrington rotation from the 5th to 95th percentile. Each panel shows the respective histograms for each of the four coronal hole wind types of interest. From top to bottom: Zhao et al. (2009) coronal hole, Xu & Borovsky (2015) coronal hole, 7-means CH1, and 7-means CH2. In panels (a)–(d), the decision threshold from Zhao et al. (2009) is indicated with a dashed horizontal cyan line. Green shading in all panels highlights 2009.
Current usage metrics show cumulative count of Article Views (full-text article views including HTML views, PDF and ePub downloads, according to the available data) and Abstracts Views on Vision4Press platform.
Data correspond to usage on the plateform after 2015. The current usage metrics is available 48-96 hours after online publication and is updated daily on week days.
Initial download of the metrics may take a while.