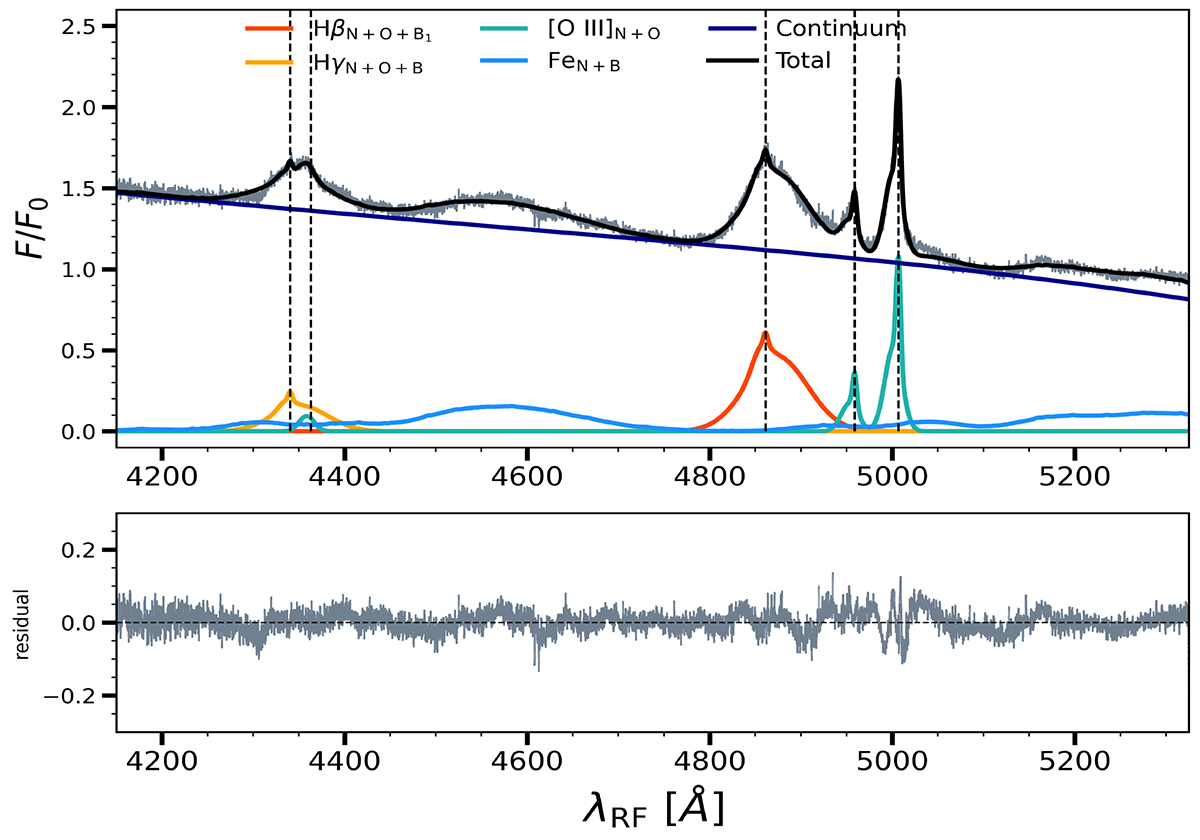
Fig. A.1.
Download original image
Best-fit result of Model 2 on the ESPRESSO data. The top panel shows the data in gray smoothed with a Gaussian Kernel (σ ≃ 0.07 Å), the best-fit model (black line), and all the emission components identified by different colors: Hγ in gold, Hβ in red, [OIII] in cyan, Fe in light-blue and the continuum in dark blue. The vertical dashed lines indicate, the rest-frame emission wavelength of the Hγ, Hβ, and [OIII]. The bottom panel represents the residuals defined as (data-model)/error, the horizontal dashed black line at the zero level of residuals is plotted to guide the eyes.
Current usage metrics show cumulative count of Article Views (full-text article views including HTML views, PDF and ePub downloads, according to the available data) and Abstracts Views on Vision4Press platform.
Data correspond to usage on the plateform after 2015. The current usage metrics is available 48-96 hours after online publication and is updated daily on week days.
Initial download of the metrics may take a while.