Fig. 5.
Download original image
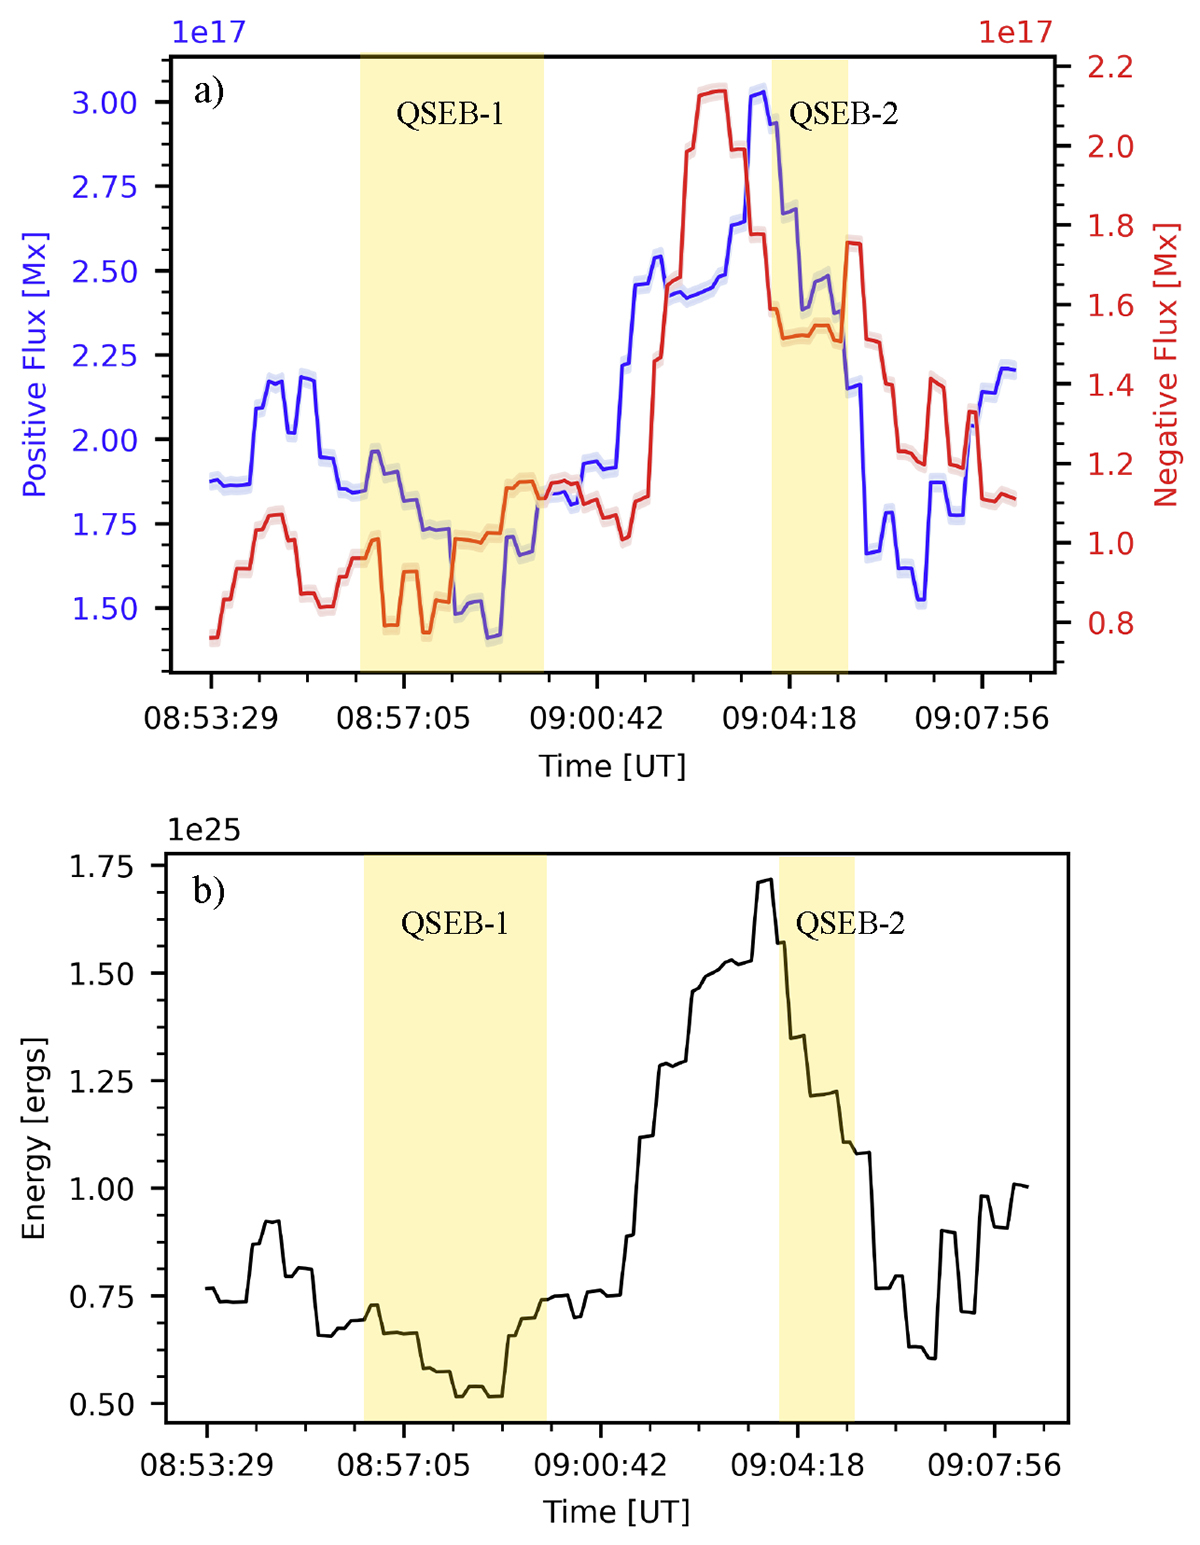
Evolution of positive and negative magnetic flux and magnetic energy for the two QSEBs with dipole magnetic field configurations in Region 1. The error in positive and negative flux is shown as thin-shaded regions along the curves. The region used to calculate these quantities is outlined in Fig. 3b. The yellow-shaded regions denote the QSEB occurrences.
Current usage metrics show cumulative count of Article Views (full-text article views including HTML views, PDF and ePub downloads, according to the available data) and Abstracts Views on Vision4Press platform.
Data correspond to usage on the plateform after 2015. The current usage metrics is available 48-96 hours after online publication and is updated daily on week days.
Initial download of the metrics may take a while.