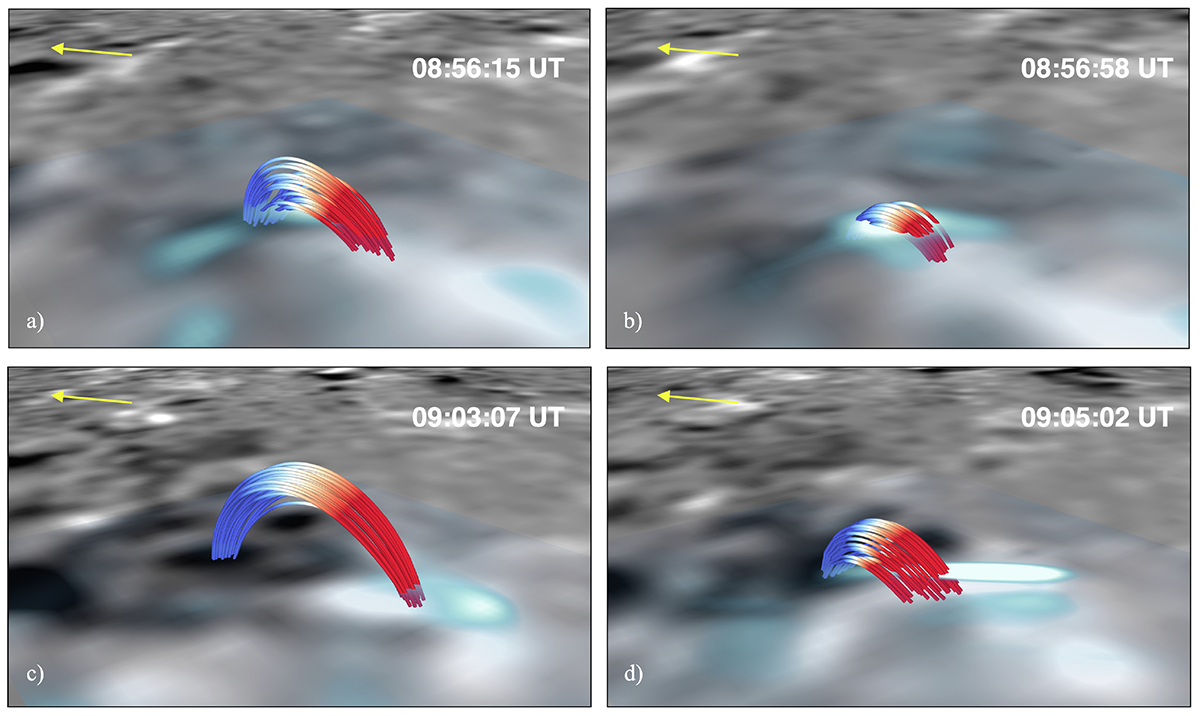
Fig. 4.
Download original image
Magnetic topology of the two QSEBs with dipole configurations in Region 1. Panels (a) and (c) show the loops connecting the positive and negative polarities before the two QSEBs occur. The height of the loops are 200 km and 323 km, respectively. The heights of the same loops reduce to 90 km and 160 km in panels (b) and (d) when the QSEBs occur. In this (and subsequent) VAPOR visualisation(s), the grey-scale image at the bottom shows the BLOS map, and the higher image shows the Hβ wing in light blue and white shades. The QSEBs are visible as elongated white patches in the right column. The yellow arrow shows the direction towards the closest solar limb.
Current usage metrics show cumulative count of Article Views (full-text article views including HTML views, PDF and ePub downloads, according to the available data) and Abstracts Views on Vision4Press platform.
Data correspond to usage on the plateform after 2015. The current usage metrics is available 48-96 hours after online publication and is updated daily on week days.
Initial download of the metrics may take a while.