Fig. 11.
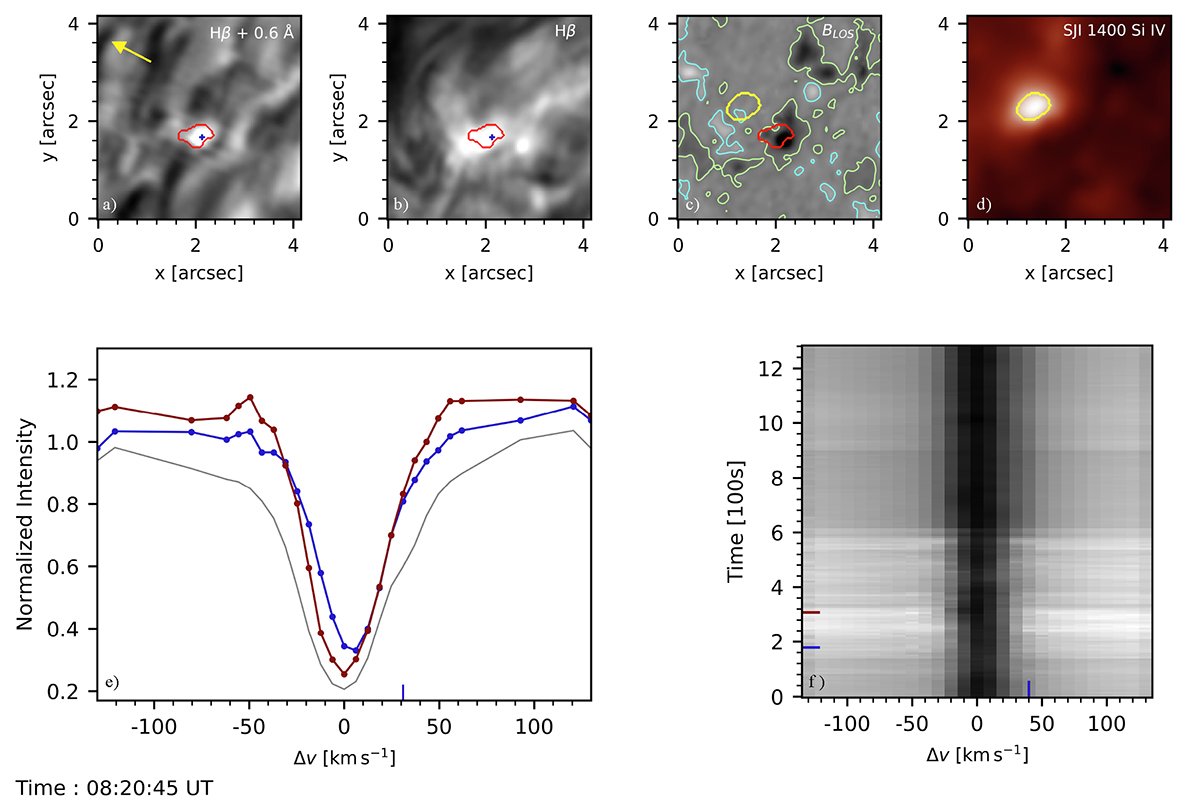
Download original image
Details of the QSEB occurring at the footpoint of the inner spine of a 3D fan-spine topology in Region 2. The top row shows the QSEB in Hβ +0.6 Å, in Hβ core, the BLOS map with contours at 2σ above the noise level, and SJI 1400. The yellow contours in panel (d) show region with > 5σ intensity in SJI 1400. Panel (e) shows the normalised intensity in Hβ at the blue cross in the above Hβ +0.6 Å image. The Hβ spectra are shown for two instances – blue shows significant line core brightening, and maroon shows wing enhancement. The Hβ core also shows the QSEB, as this event has considerable brightening of the line core. Panel (f) shows the λt diagram for the blue marker over the QSEB. The position of this marker has been adjusted a few times to obtain the strongest spectra for each timestep. The vertical blue markers in panels (e) and (f) denote the position of the wing of Hβ line for which the image is shown in panel (a). The horizontal blue marker in panel (f) denotes the time of the snapshot shown in this figure. The horizontal maroon marker denotes the time for the maroon Hβ spectra in panel (e). The yellow arrow shows the direction to the nearest limb. An animation of this figure, which shows the evolution of this QSEB, is available in the online material.
Current usage metrics show cumulative count of Article Views (full-text article views including HTML views, PDF and ePub downloads, according to the available data) and Abstracts Views on Vision4Press platform.
Data correspond to usage on the plateform after 2015. The current usage metrics is available 48-96 hours after online publication and is updated daily on week days.
Initial download of the metrics may take a while.