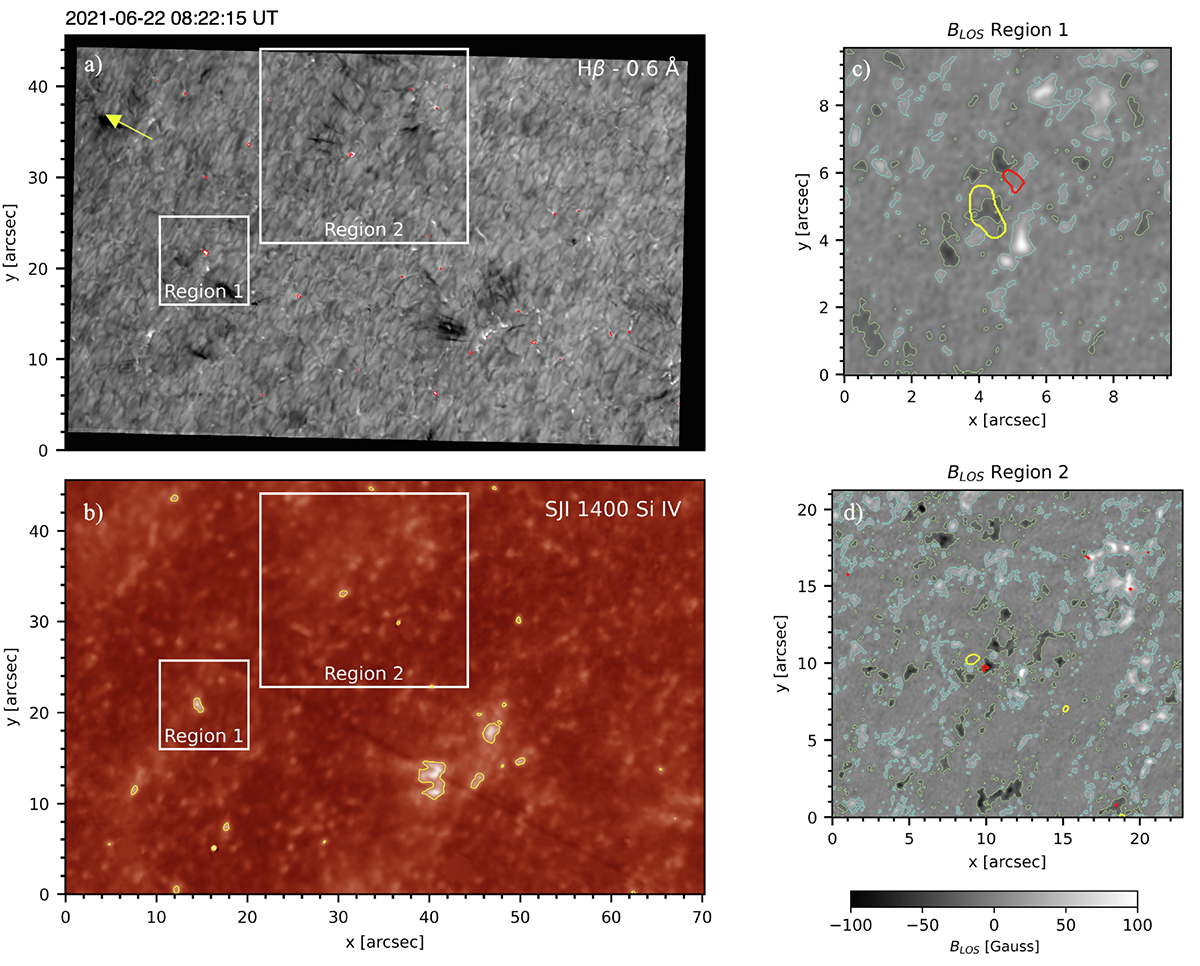
Fig. 1.
Download original image
Overview of the observed region in the Hβ blue wing, SJI 1400, and magnetic field (BLOS). The two white squares mark the regions with continuous QSEB and UV brightening activity. The first four events analysed in this paper occurred in Region 1, and the fifth event occurred in Region 2. Red contours at the top outline the QSEB detections. Yellow contours outline > 5σ UV brightenings. The arrow in the top panel shows the direction towards the nearest limb. BLOS maps with contours at 2σ above the noise level for these two regions are shown on the right, with the QSEB and UV brightening contours. The values for BLOS in panels (c) and (d) have been saturated to ±100 G for better representation.
Current usage metrics show cumulative count of Article Views (full-text article views including HTML views, PDF and ePub downloads, according to the available data) and Abstracts Views on Vision4Press platform.
Data correspond to usage on the plateform after 2015. The current usage metrics is available 48-96 hours after online publication and is updated daily on week days.
Initial download of the metrics may take a while.