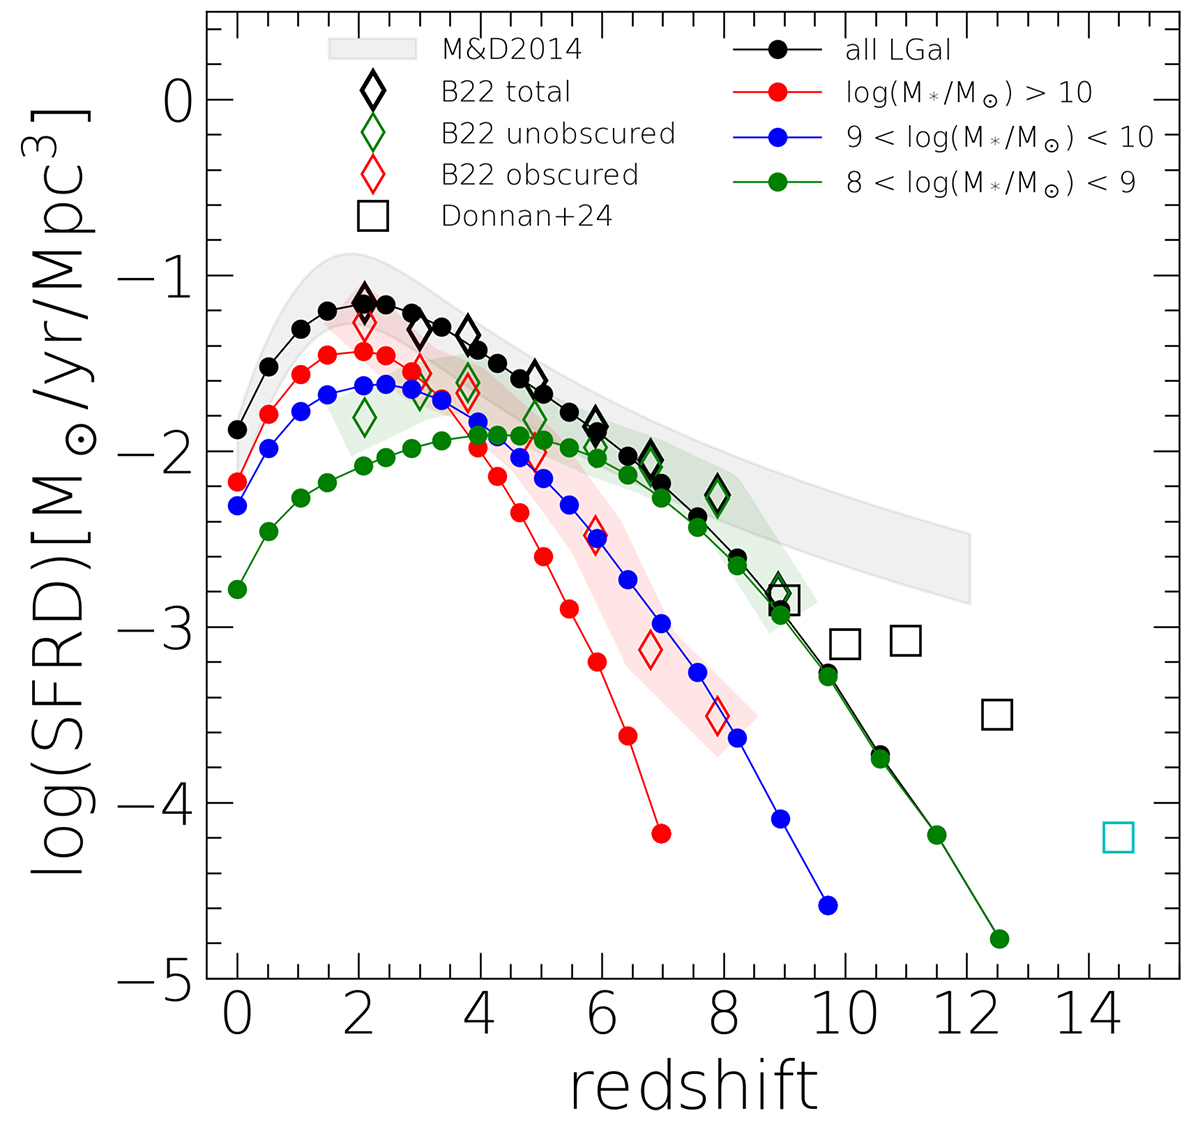
Fig. A.1.
Download original image
Cosmic star-formation rate density. Gray shaded region shows CSFRD from Madau & Dickinson (2014) scaled to the Chabrier (2003) IMF. Black dots and line represent a total CSFRD estimated using L-GALAXIES2020 above the stellar mass limit (> 108 M⊙). The red, blue and green points and lines represent L-GALAXIES2020 subsamples in stellar mass bins. Diamonds show data from Bouwens et al. (2022) for total (black), unobscured (green) and obscured (red) estimates of CSFRD, with shaded regions only for visualization purposes; squares show data from Donnan et al. (2024), while the cyan square is the tentative estimates based on a scarce sample size at z = 14.5 from their work.
Current usage metrics show cumulative count of Article Views (full-text article views including HTML views, PDF and ePub downloads, according to the available data) and Abstracts Views on Vision4Press platform.
Data correspond to usage on the plateform after 2015. The current usage metrics is available 48-96 hours after online publication and is updated daily on week days.
Initial download of the metrics may take a while.