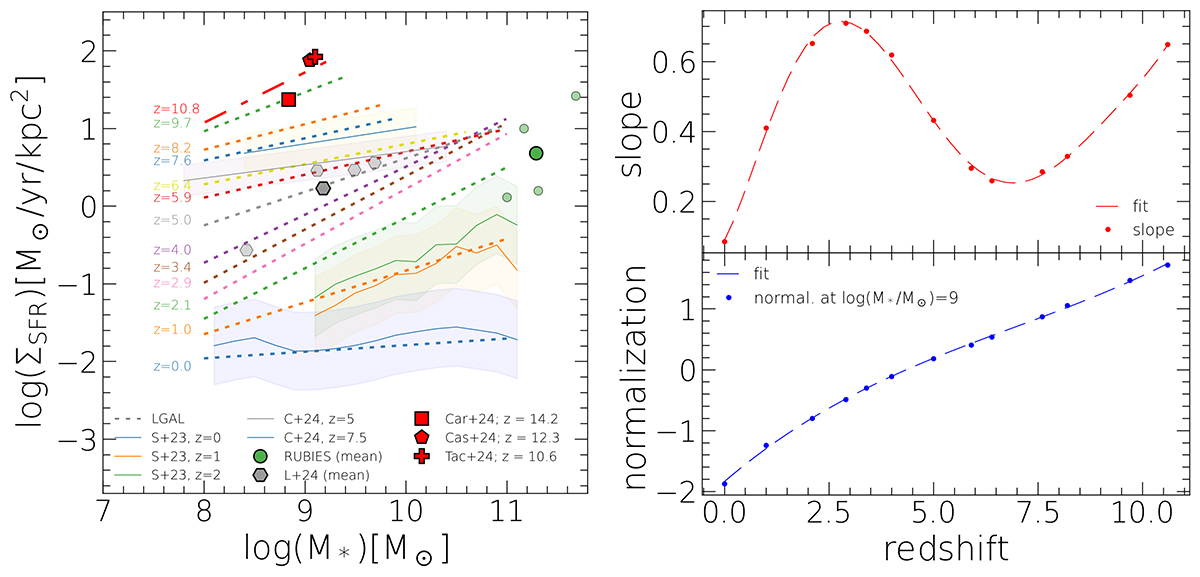
Fig. 2.
Download original image
Star formation surface density ΣSFR main sequence (ΣSFRMS). The dotted lines show ΣSFRMS estimated using simulated galaxies from L-GALAXIES2020 at a given reshift from z = 0 up to z ∼ 10.8 (the last dot-dashed fit includes three snapshots to increase the sample size; see Table 1). The colors indicate the (mean) redshift of the points corresponding to the ΣSFRMS with the same color. Salim et al. (2023)ΣSFRMS at z = 0, 1, 2, and Calabrò et al. (2024) at z = 5 and 7.5 are shown with solid lines in blue, orange, green, purple, and yellow with the corresponding scatter and within the stellar mass range studied in their work. The markers show individual intermediate- and high-z galaxies. Right panel: Evolution of the slope and normalization of the estimated ΣSFRMS. The polynomial coefficients are given in Equations (1) and (2).
Current usage metrics show cumulative count of Article Views (full-text article views including HTML views, PDF and ePub downloads, according to the available data) and Abstracts Views on Vision4Press platform.
Data correspond to usage on the plateform after 2015. The current usage metrics is available 48-96 hours after online publication and is updated daily on week days.
Initial download of the metrics may take a while.