Fig. 1.
Download original image
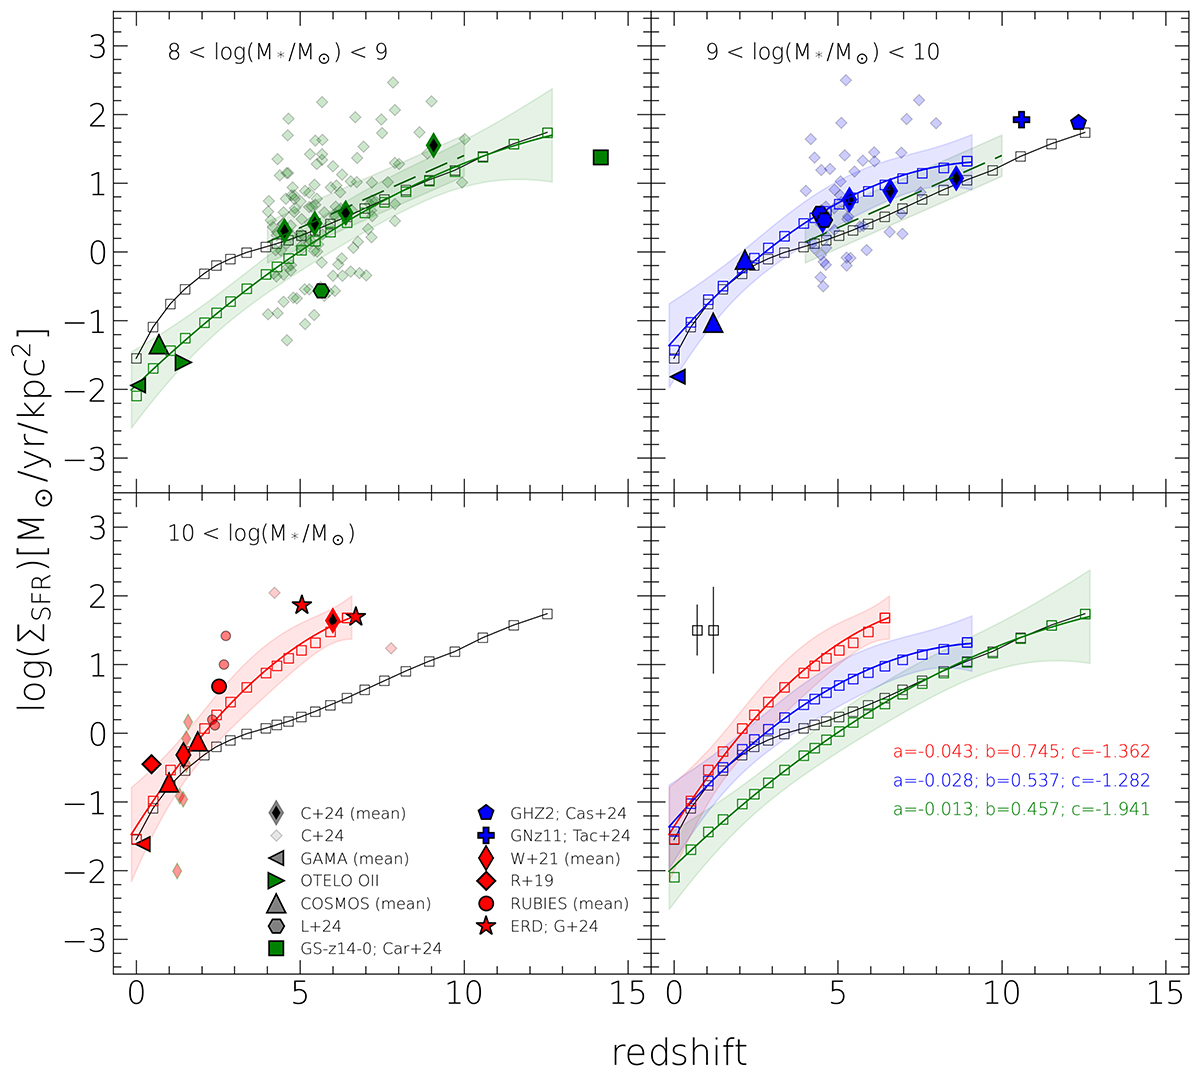
Star formation rate surface density ΣSFR as a function of redshift. The empty black squares show the median values for all the galaxies from L-GALAXIES2020 with M* > 108 M⊙. The empty green, blue and redsquares show the median values for the L-GALAXIES2020 sample divided into stellar mass bins with log(M*/M⊙) between 8 and 9, 9 and 10, and above 10. The lines of the same colors are the second-degree polynomial, and the coefficients are given in the bottom right panel. We show the observational data described in Section 2.3, color-coded by their stellar mass, indicated at the top of each panel. The Calabrò et al. (2024) mean values are shown in bins of stellar mass and redshift, and individual galaxies are shown as small diamonds. The dashed green line (only in the top panels) shows the fit from Calabrò et al. (2024). The values of the median of L-GALAXIES2020 SAM are given in Table 2.
Current usage metrics show cumulative count of Article Views (full-text article views including HTML views, PDF and ePub downloads, according to the available data) and Abstracts Views on Vision4Press platform.
Data correspond to usage on the plateform after 2015. The current usage metrics is available 48-96 hours after online publication and is updated daily on week days.
Initial download of the metrics may take a while.