Fig. 2.
Download original image
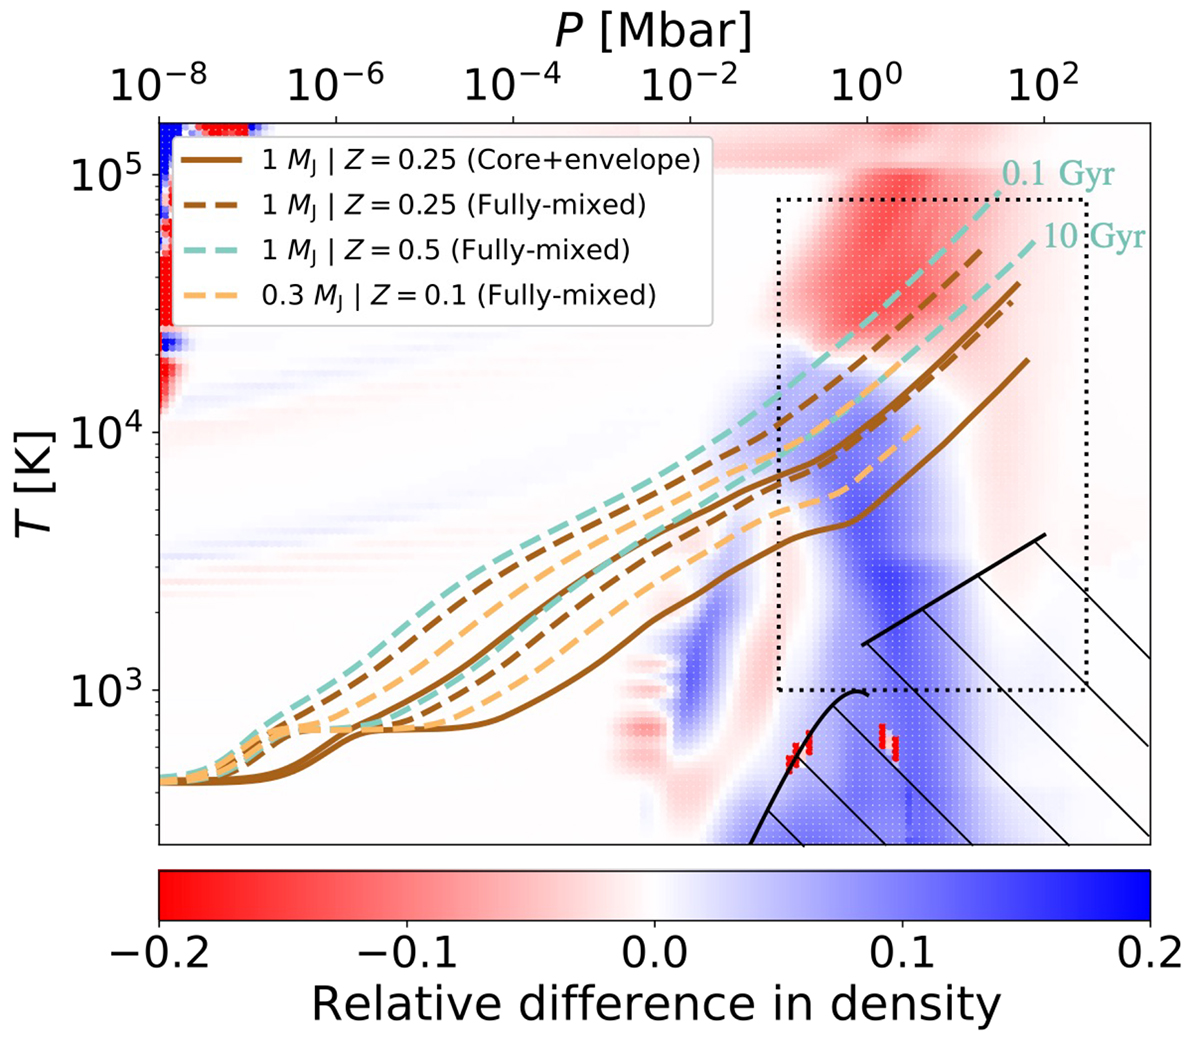
Relative difference in density between the CMS19+HG23 (Chabrier et al. 2019; Howard & Guillot 2023) and SCvH95 (Saumon et al. 1995) EOSs. Blue regions on the T–P diagram indicate where CMS19+HG23 is denser than SCvH95, while red regions highlight less dense areas. The coloured solid and dashed lines show T–P profiles of some models (using CMS19+HG23) from Fig. 1, at 0.1 or 10 Gyr. The dotted square indicates the region of the ab initio presented by Militzer & Hubbard (2013). The CMS19+HG23 EOS is more accurate in this region. The hashed area corresponds to the region where hydrogen becomes solid (see e.g. Chabrier et al. 2019).
Current usage metrics show cumulative count of Article Views (full-text article views including HTML views, PDF and ePub downloads, according to the available data) and Abstracts Views on Vision4Press platform.
Data correspond to usage on the plateform after 2015. The current usage metrics is available 48-96 hours after online publication and is updated daily on week days.
Initial download of the metrics may take a while.