Fig. B.1
Download original image
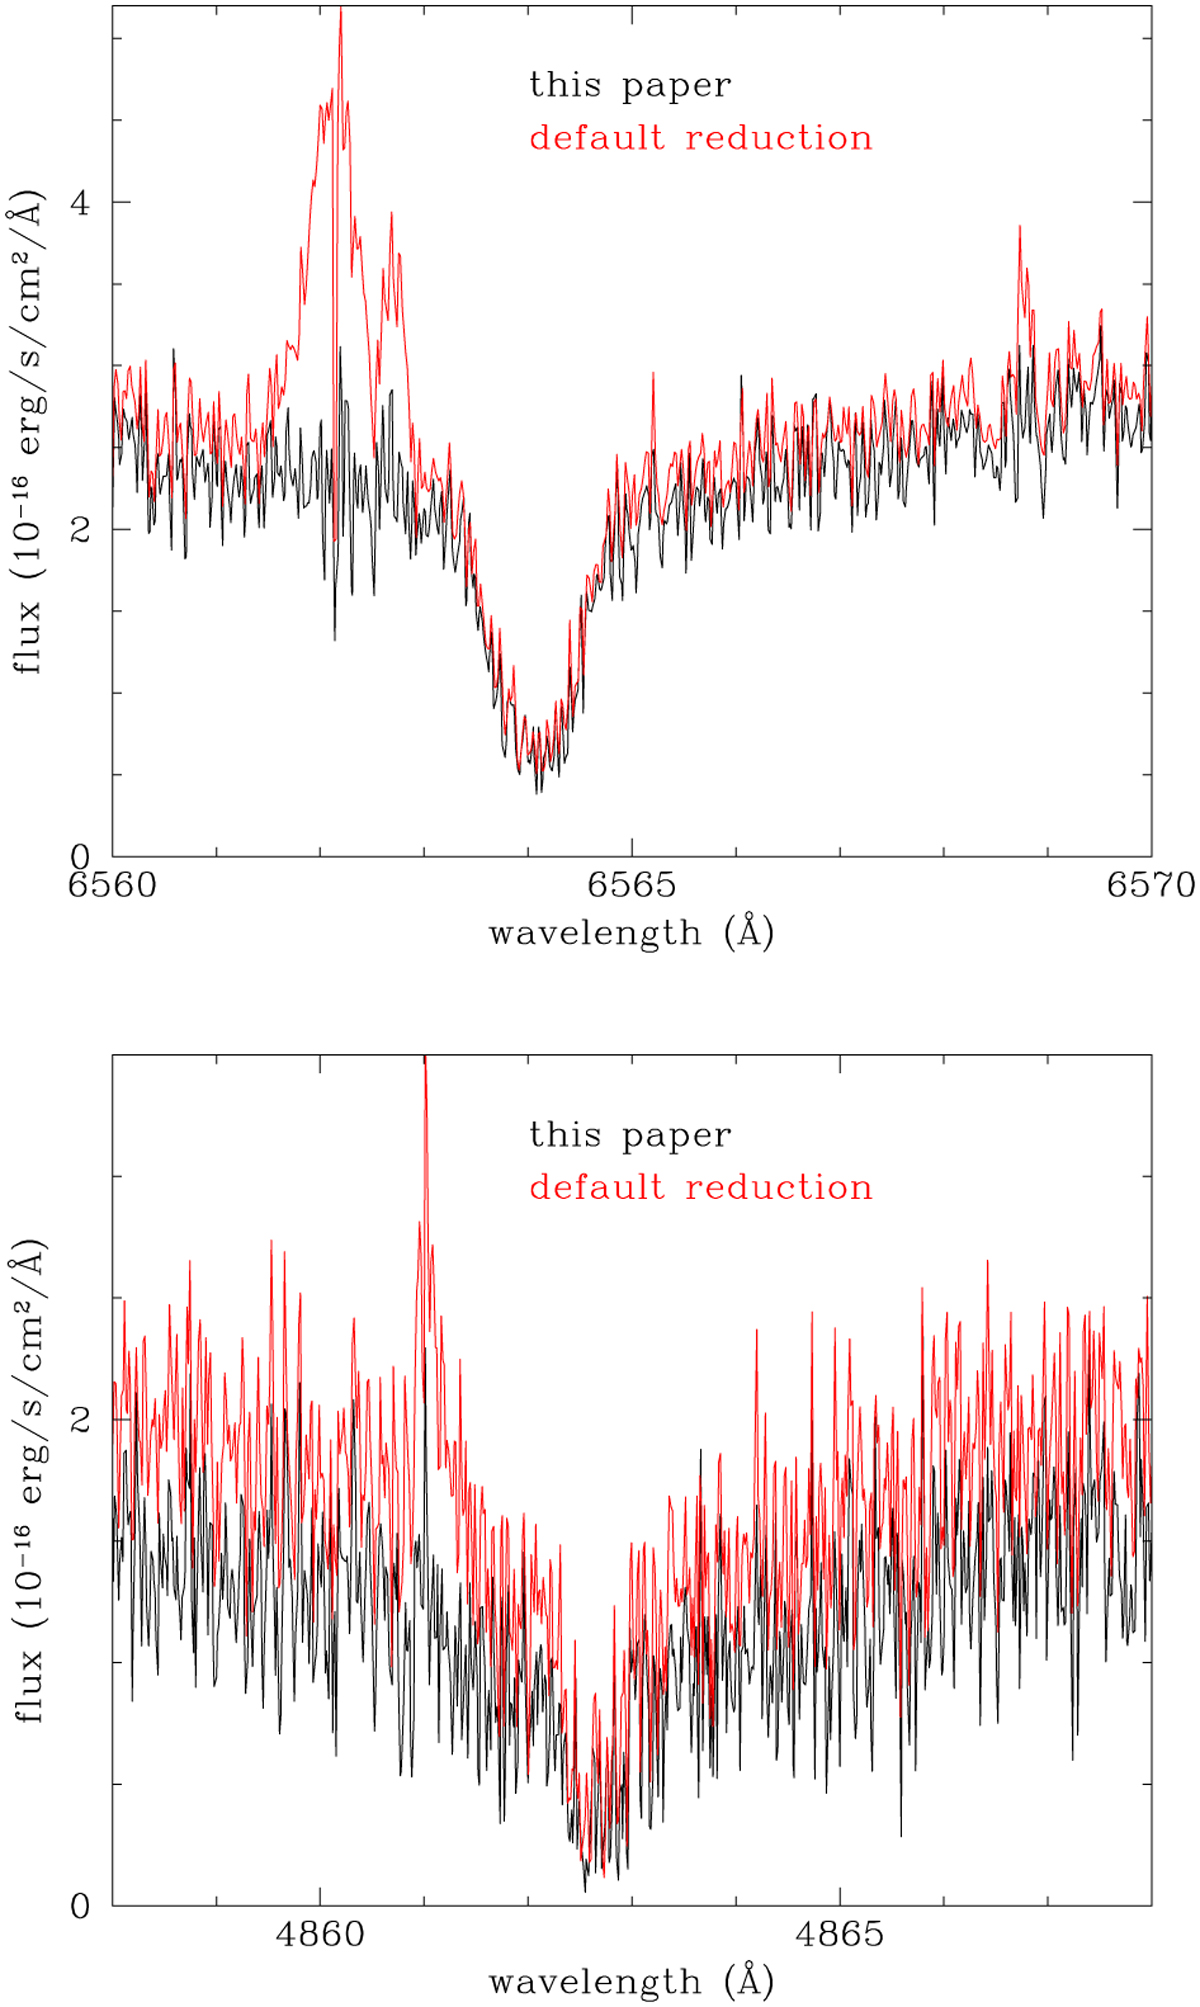
Top: Hɑ region of the second observation of 5235 from 5 May 2002, reduced as described here (black) and with default reduction parameters (red). One can clearly see the spurious emission on the blue side of the stellar Hɑ line core. Bottom: Hβ region of the observation of 7788 from 12 June 2002, reduced as described here (black) and with default reduction parameters (red). One can clearly see the spurious emission on the blue side of the stellar Hβ line core.
Current usage metrics show cumulative count of Article Views (full-text article views including HTML views, PDF and ePub downloads, according to the available data) and Abstracts Views on Vision4Press platform.
Data correspond to usage on the plateform after 2015. The current usage metrics is available 48-96 hours after online publication and is updated daily on week days.
Initial download of the metrics may take a while.