Fig. 3.
Download original image
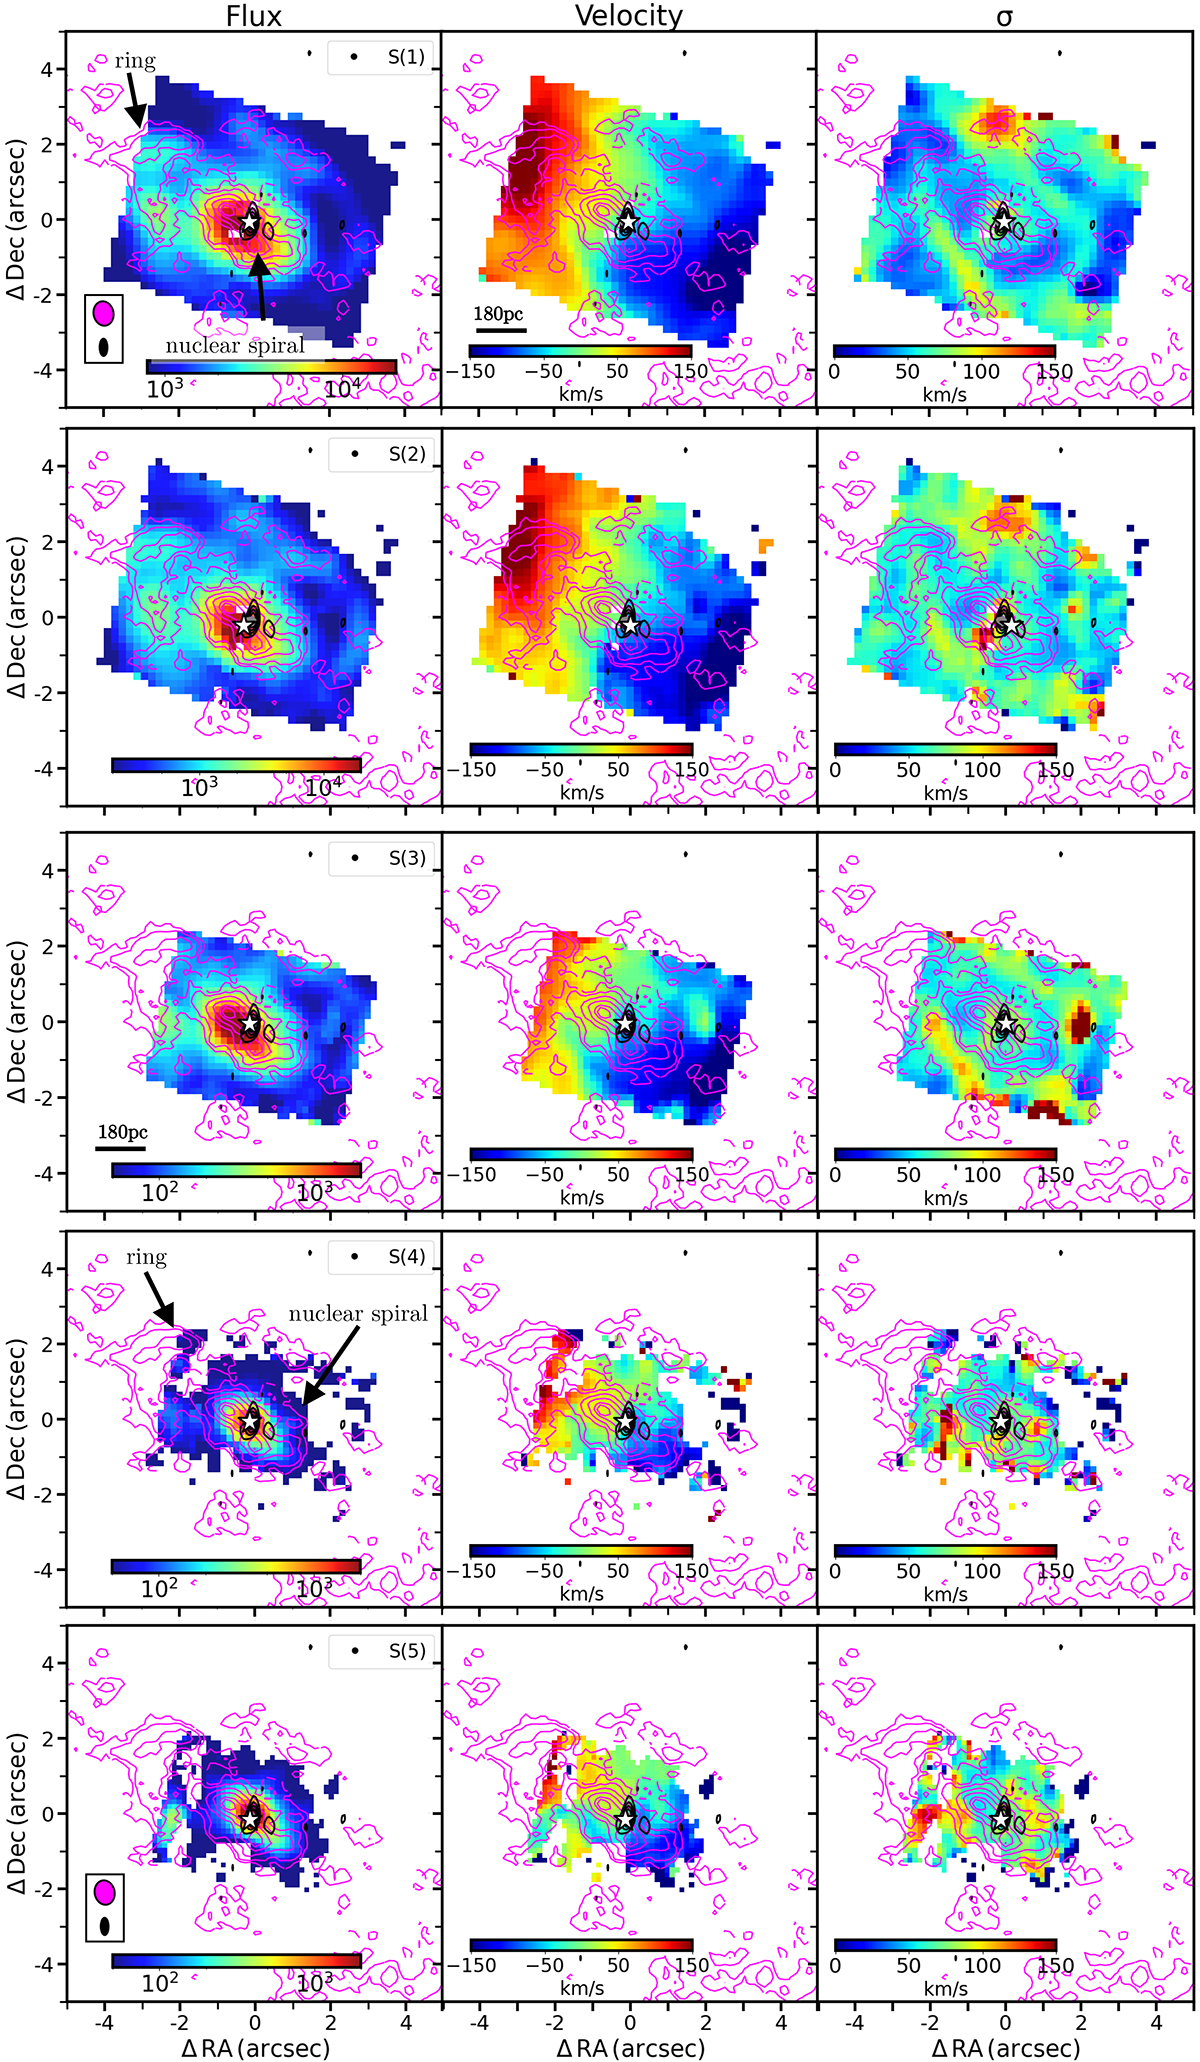
Flux [ × 10−20 erg s−1 cm−2] (left), velocity [km/s] (center), and velocity dispersion [km/s] (right) maps of the different H2 rotational transitions detected in the MIRI/MRS data. The magenta contours represent 10%, 20%, 30%, 40%, 50%, 60%, 70%, 80%, and 90% of the maximum ALMA CO(2−1) flux. For the S(1), S(2), and S(3) maps we also included the ALMA contours corresponding to 7% and 8% of the maximum flux. The black contours correspond to the 5%, 10%, 15%, and 20% of the average σ (∼2.85 × 10⁻⁵) in the VLA 8.4 GHz image. The white star shows the AGN location according to the ALMA continuum. The VLA and ALMA beams, corresponding to 0![]() 14 × 0
14 × 0![]() 30 and 0
30 and 0![]() 68 × 0
68 × 0![]() 83, are shown in the S(1) and S(5) flux maps.
83, are shown in the S(1) and S(5) flux maps.
Current usage metrics show cumulative count of Article Views (full-text article views including HTML views, PDF and ePub downloads, according to the available data) and Abstracts Views on Vision4Press platform.
Data correspond to usage on the plateform after 2015. The current usage metrics is available 48-96 hours after online publication and is updated daily on week days.
Initial download of the metrics may take a while.