Fig. 9
Download original image
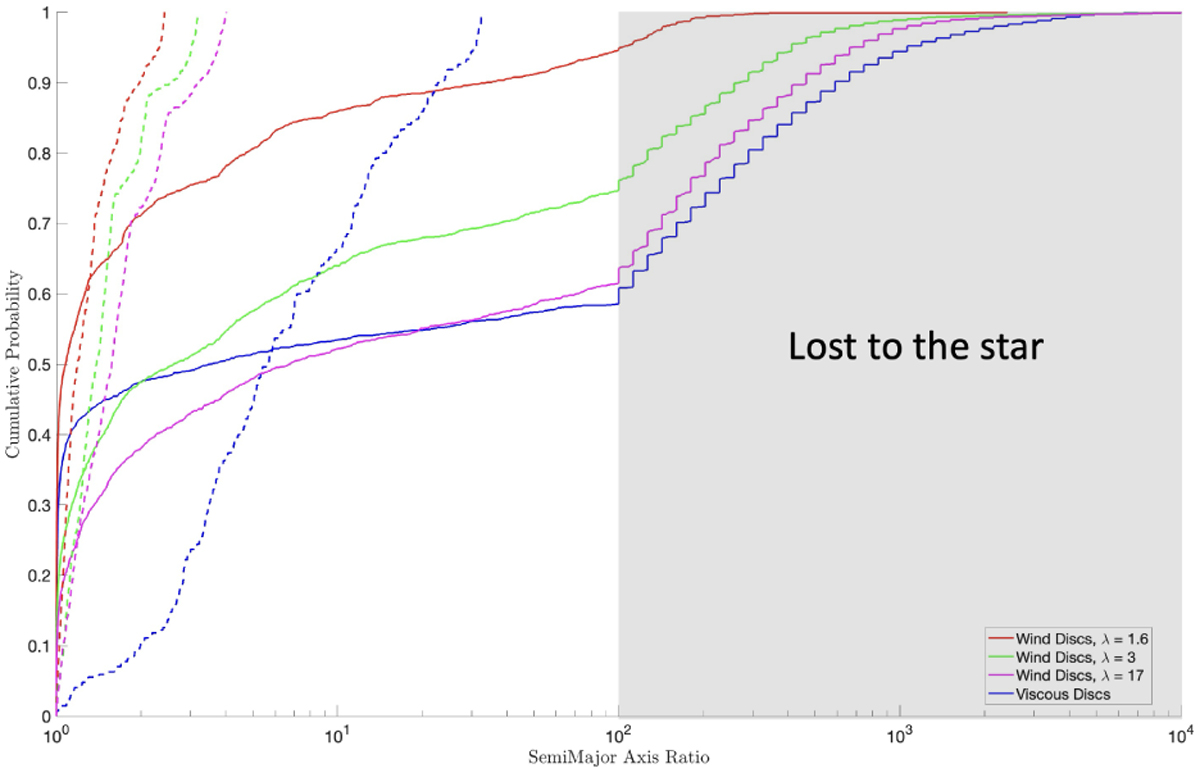
Figure showing the ratios of the initial location to the critical location (rcrit) where giant planets started rapid gas accretion (solid lines), representing Type 1 migration. Dashed lines show the ratios of rcrit to the final location, representing Type 2 migration. Red, green, and magenta lines represent planets formed in wind-driven discs with λ = 1.6, 3, and 17, respectively, while blue lines represent those formed in purely viscously evolving discs.
Current usage metrics show cumulative count of Article Views (full-text article views including HTML views, PDF and ePub downloads, according to the available data) and Abstracts Views on Vision4Press platform.
Data correspond to usage on the plateform after 2015. The current usage metrics is available 48-96 hours after online publication and is updated daily on week days.
Initial download of the metrics may take a while.