Fig. 3
Download original image
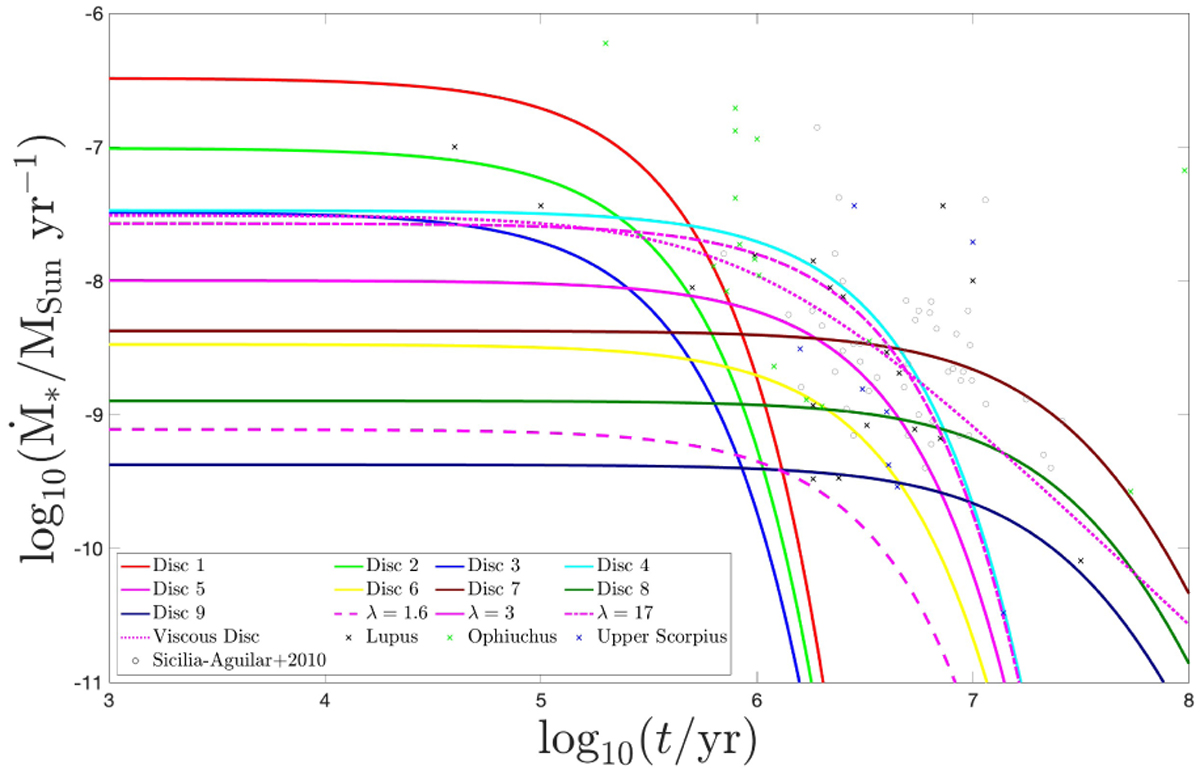
Temporal profile of stellar accretion rates for the nine discs studied in this work (Table 1) when λ = 3. Additionally, cases with λ = 1.6, λ = 17, and purely viscously evolving scenarios for disc 5 are also shown. Various symbols correspond to observed values: black cross markers: Batalha & Basri (1993); Galli et al. (2015); Nuernberger et al. (1997); Andrews et al. (2018); Alcalá et al. (2014); Green cross markers: Andrews et al. (2018); Erickson et al. (2011); Andrews et al. (2010); Blue cross markers: Herczeg & Hillenbrand (2014); Garufi et al. (2020); Sicilia-Aguilar+2020: Sicilia-Aguilar et al. (2010).
Current usage metrics show cumulative count of Article Views (full-text article views including HTML views, PDF and ePub downloads, according to the available data) and Abstracts Views on Vision4Press platform.
Data correspond to usage on the plateform after 2015. The current usage metrics is available 48-96 hours after online publication and is updated daily on week days.
Initial download of the metrics may take a while.