Fig. 2
Download original image
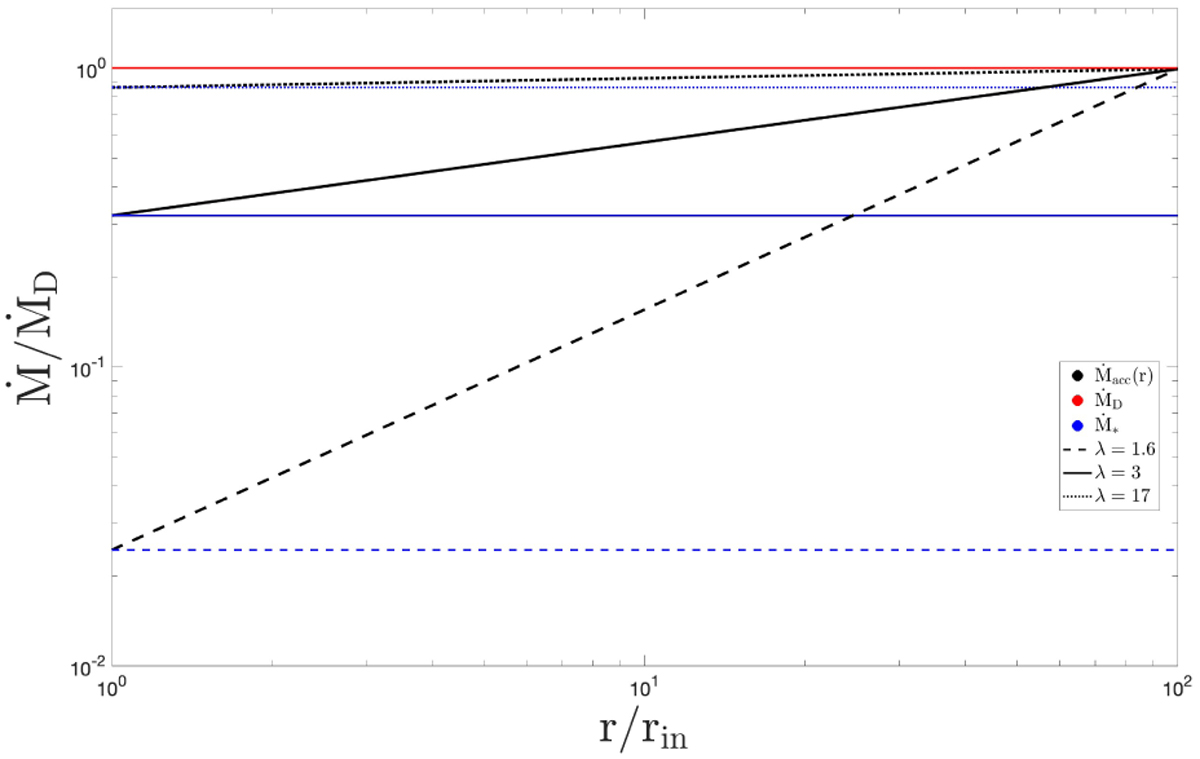
Radial profiles of the local disc accretion rates Ṁacc normalised to the disc accretion rate ṀD are shown for Disc 5 with λ = 1.6 (black dashed line), λ = 3.0 (black solid line), and λ = 17 (black dotted line). Also plotted are the normalised stellar mass accretion rate Ṁ* (blue lines) and the normalised disc mass loss rates ṀD (red line). For the same disc model, ṀD is the same for all values of λ. Due to the substantial wind mass loss, the smaller λ leads to the steeper radial dependence of Ṁacc.
Current usage metrics show cumulative count of Article Views (full-text article views including HTML views, PDF and ePub downloads, according to the available data) and Abstracts Views on Vision4Press platform.
Data correspond to usage on the plateform after 2015. The current usage metrics is available 48-96 hours after online publication and is updated daily on week days.
Initial download of the metrics may take a while.