Fig. A.1
Download original image
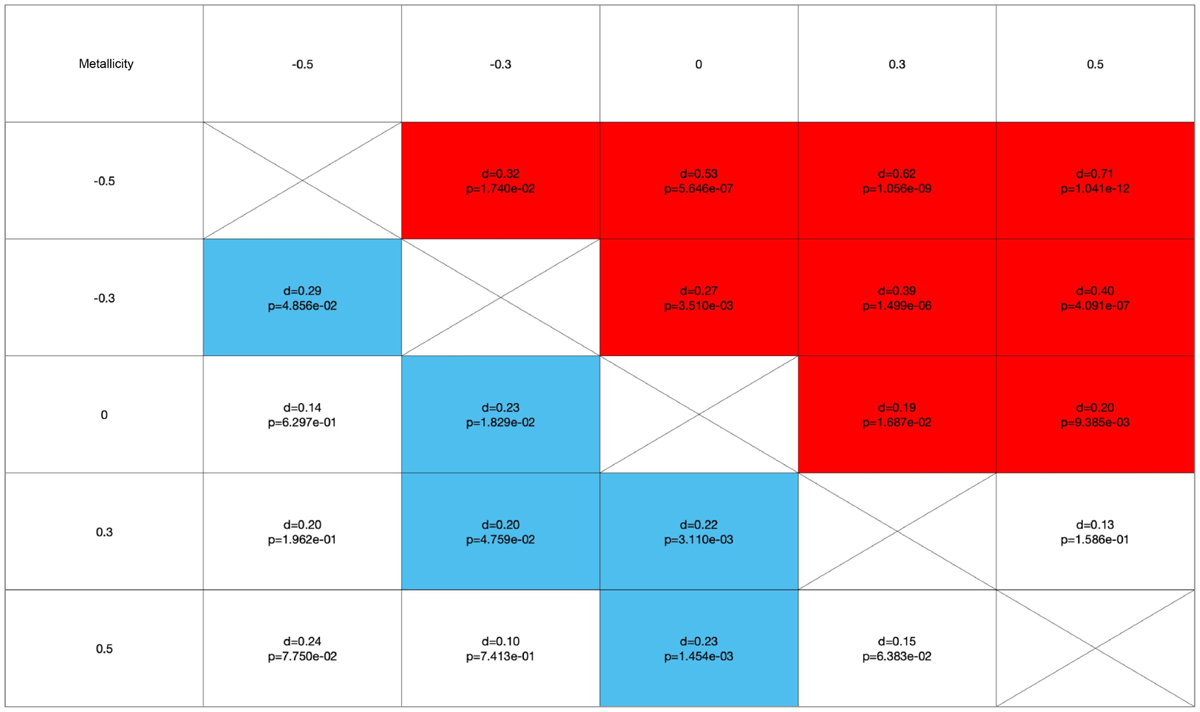
KS test results for metallicity analysis with λ = 3 for high-mass planets. The bottom-left triangle represents the test results for planetary mass, while the top-right triangle represents the results for orbital radius. The two-sample KS statistic d and the corresponding probability p are shown for each metallicity sample pair. Grids with p-values less than 0.05 for orbital radius are highlighted in red, and those for planetary masses are highlighted in cyan.
Current usage metrics show cumulative count of Article Views (full-text article views including HTML views, PDF and ePub downloads, according to the available data) and Abstracts Views on Vision4Press platform.
Data correspond to usage on the plateform after 2015. The current usage metrics is available 48-96 hours after online publication and is updated daily on week days.
Initial download of the metrics may take a while.