Open Access
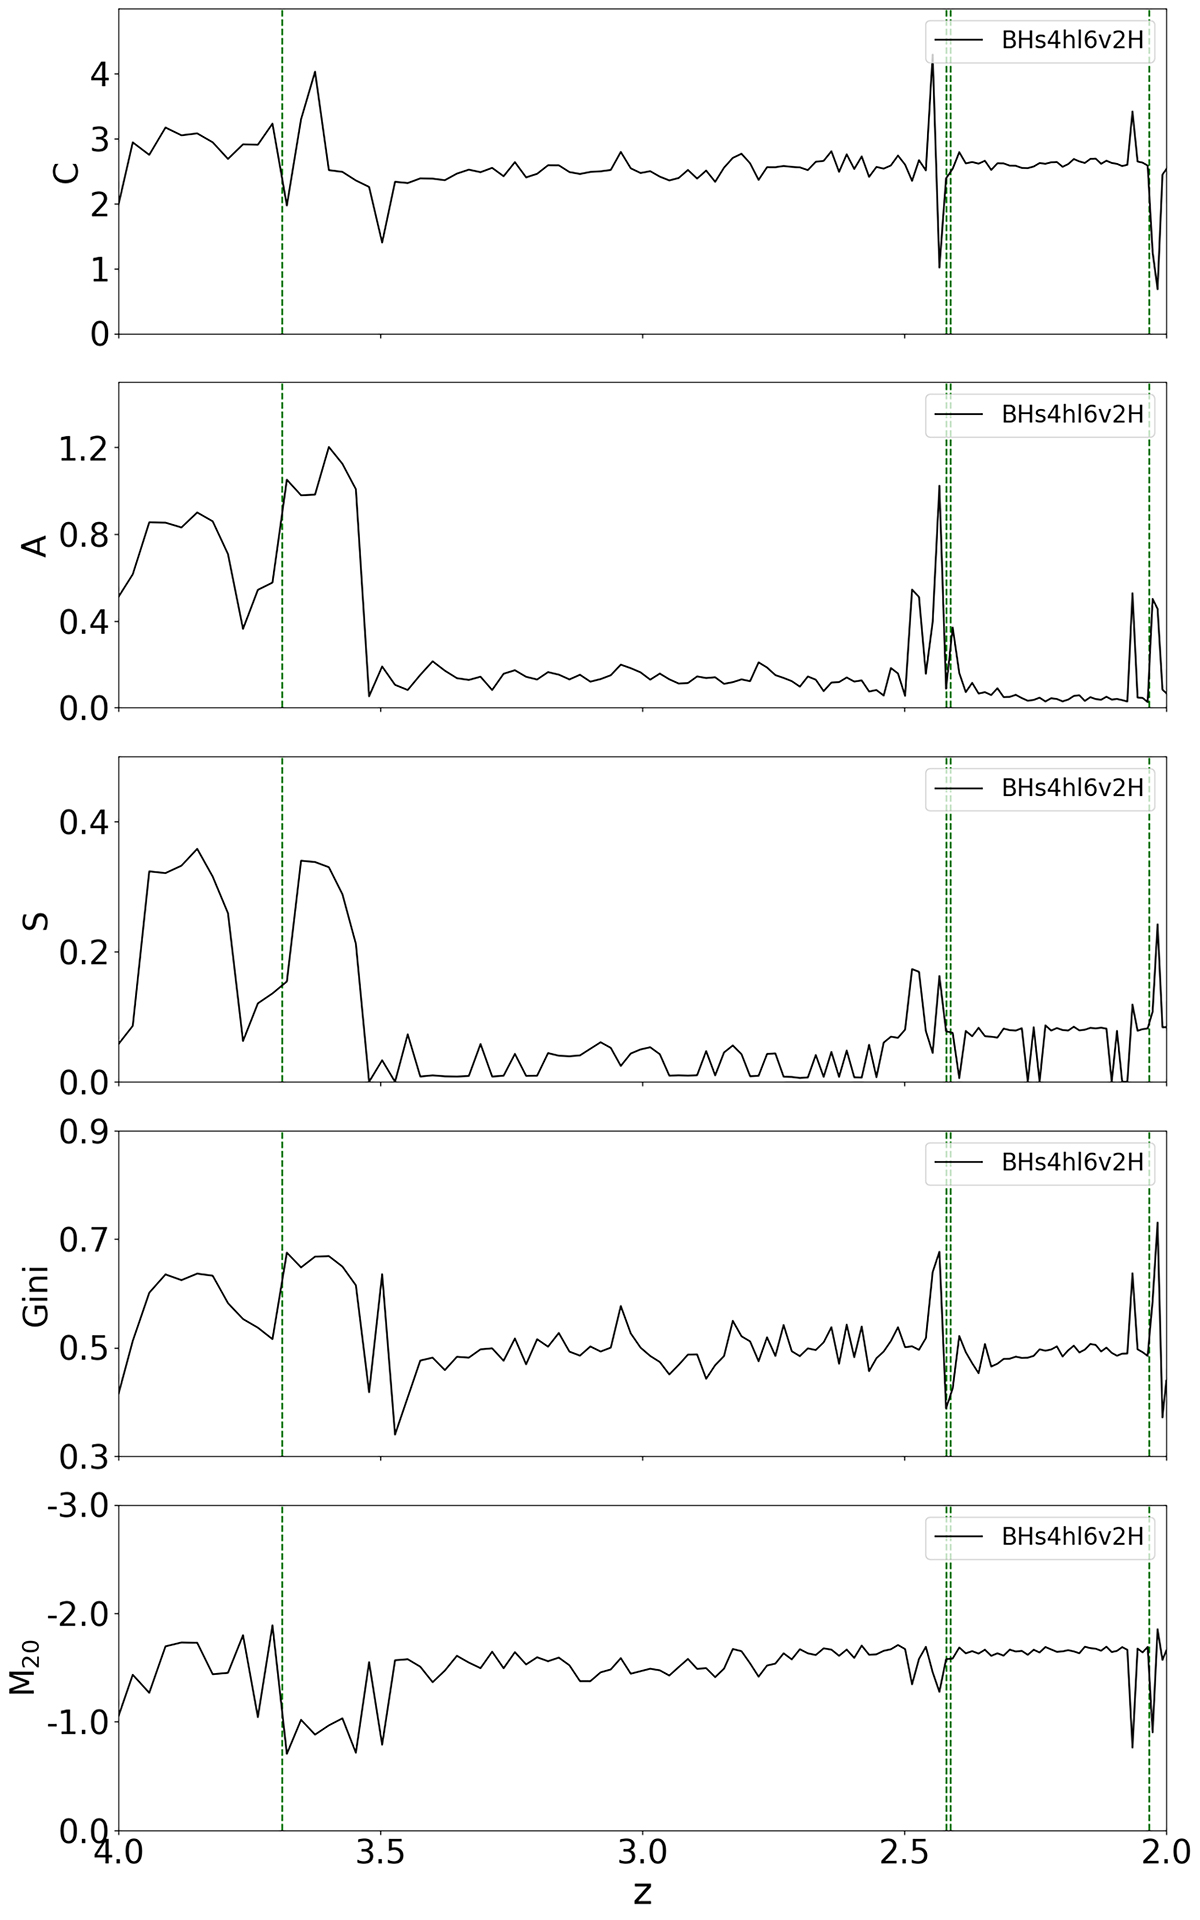
Fig. 13.
Download original image
Timeline of CAS and Gini/M20 parameters evolution for representative model BHs4hl6v2H, from redshift z = 4 to 2. Green vertical dash lines indicate major mergers.
Current usage metrics show cumulative count of Article Views (full-text article views including HTML views, PDF and ePub downloads, according to the available data) and Abstracts Views on Vision4Press platform.
Data correspond to usage on the plateform after 2015. The current usage metrics is available 48-96 hours after online publication and is updated daily on week days.
Initial download of the metrics may take a while.