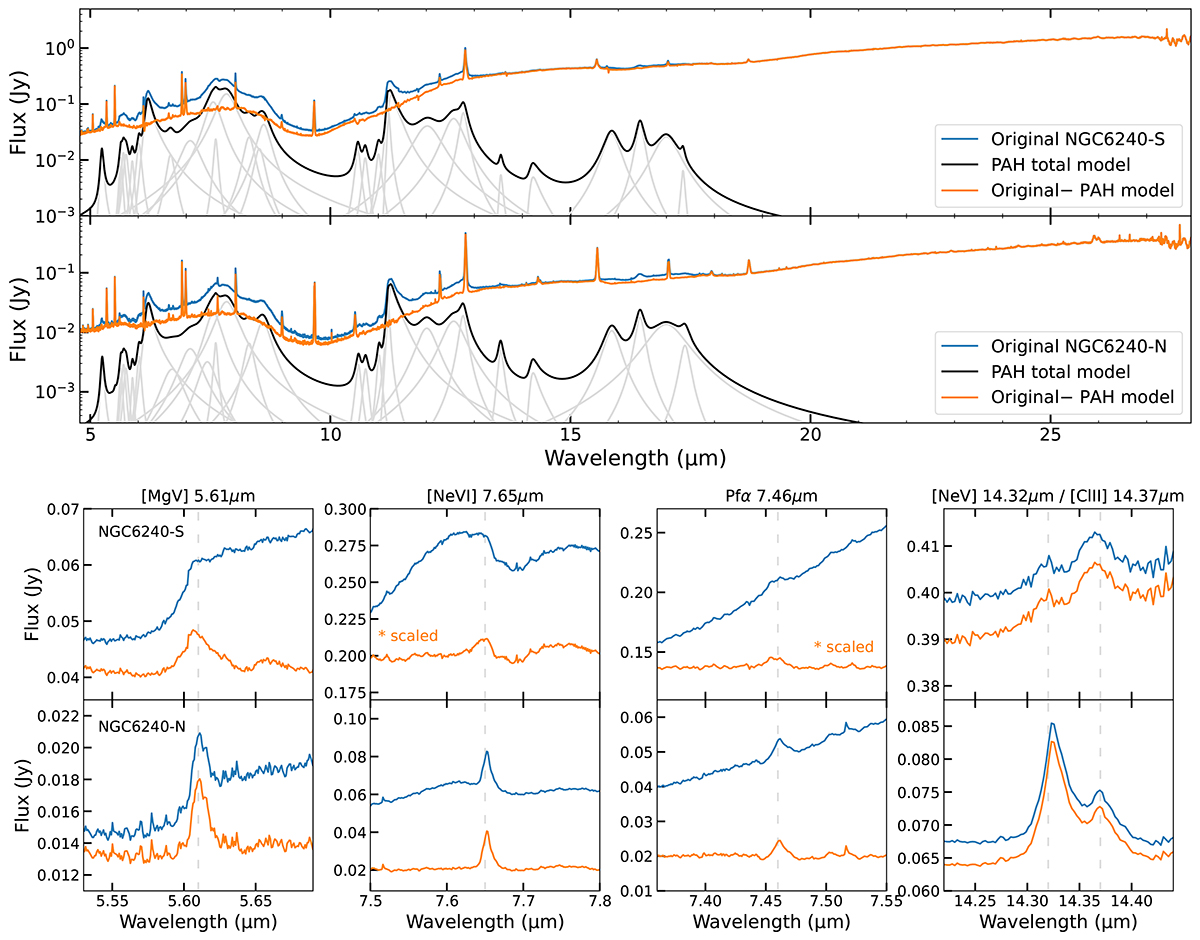
Fig. 9.
Download original image
Full integrated (r ∼ 0.7″) spectrum of the two nuclei in rest frame after modelling the dust features and continuum (see details in Sect. 4.2). The upper figures show the global fit to the S (top) and N (bottom) nucleus before (blue) and after (orange) subtracting the total PAH emission (black). The modelled contribution of the individual PAH features are shown in grey. The bottom panels show some insets near the region of [Mg V], Pfα, [Ne VI], and [Ne V] lines for both nuclei. The rest-frame wavelengths are indicated with a dashed, grey, vertical line. The Pfα and [Ne VI] lines from the S nucleus have been scaled for visualisation purposes.
Current usage metrics show cumulative count of Article Views (full-text article views including HTML views, PDF and ePub downloads, according to the available data) and Abstracts Views on Vision4Press platform.
Data correspond to usage on the plateform after 2015. The current usage metrics is available 48-96 hours after online publication and is updated daily on week days.
Initial download of the metrics may take a while.