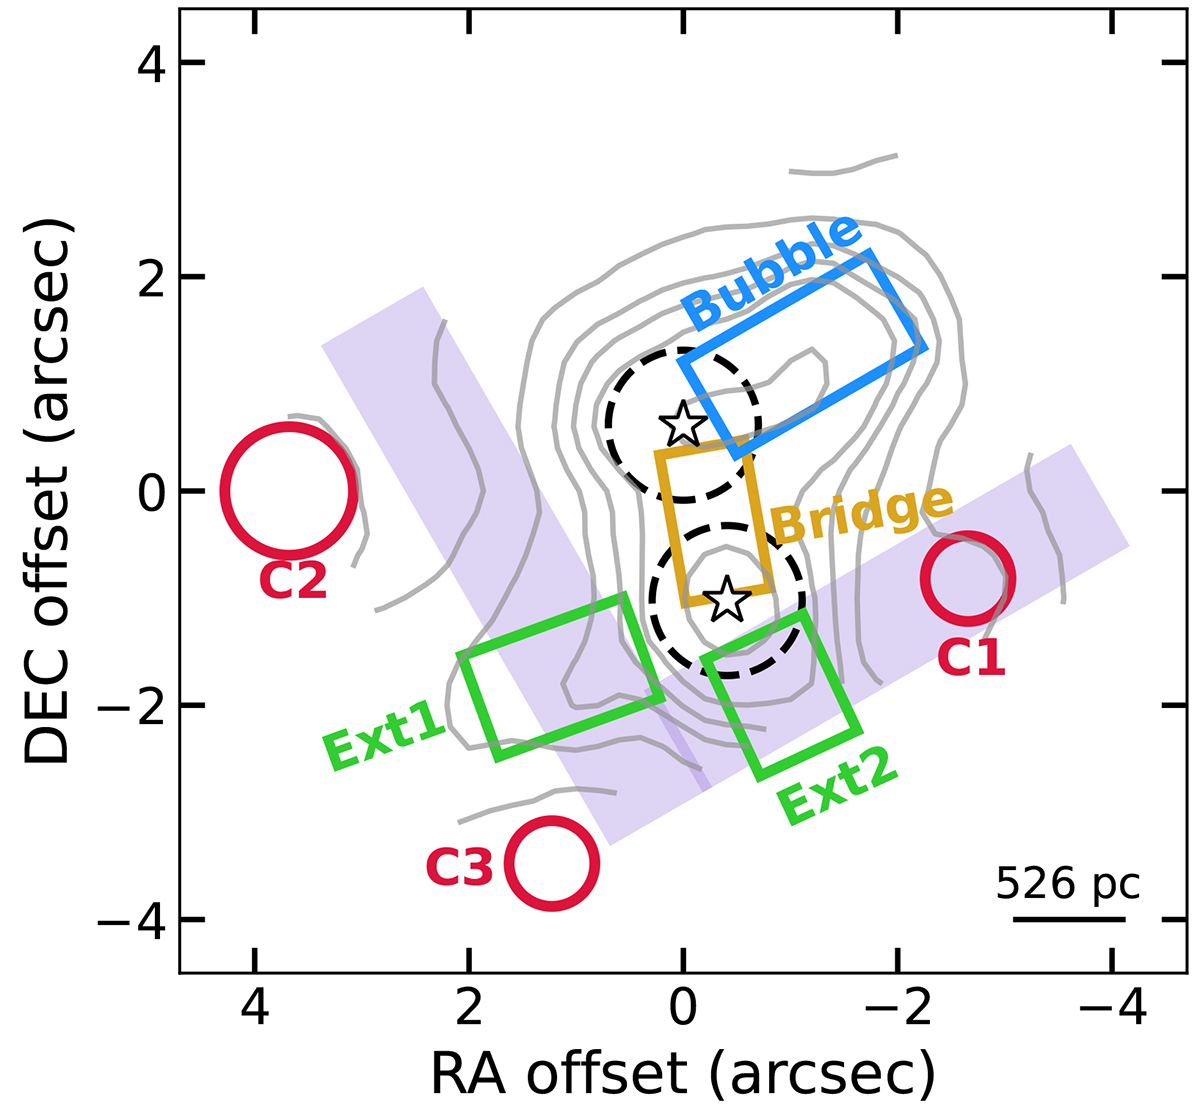
Fig. 6.
Download original image
Schematic figure of the main features seen in the flux and kinematic maps of the emission lines superimposed onto the [Ne III] flux map contours (see Fig. 4). In red we mark the position of the different detected clumps (namely C1, C2, and C3), and in green are the extended emission regions (namely Ext1 and Ext2, see Sect. 3.2). The bubble-like structure mainly detected with the high-excitation lines is in blue (extending up to ∼5.2″, i.e. 2.74 kpc; see Fig. 5 and Sect. 4.3), and the bridge detected between both nuclei (separated ∼1.6″, i.e. ∼840 pc; see Sect. 3.1) is marked in yellow. The purple regions indicate the V-shaped structure detected in the velocity dispersion maps. Additionally, we mark with black, dashed circles the region where we integrated the spectra for both nuclei, as well as their position with the white stars.
Current usage metrics show cumulative count of Article Views (full-text article views including HTML views, PDF and ePub downloads, according to the available data) and Abstracts Views on Vision4Press platform.
Data correspond to usage on the plateform after 2015. The current usage metrics is available 48-96 hours after online publication and is updated daily on week days.
Initial download of the metrics may take a while.