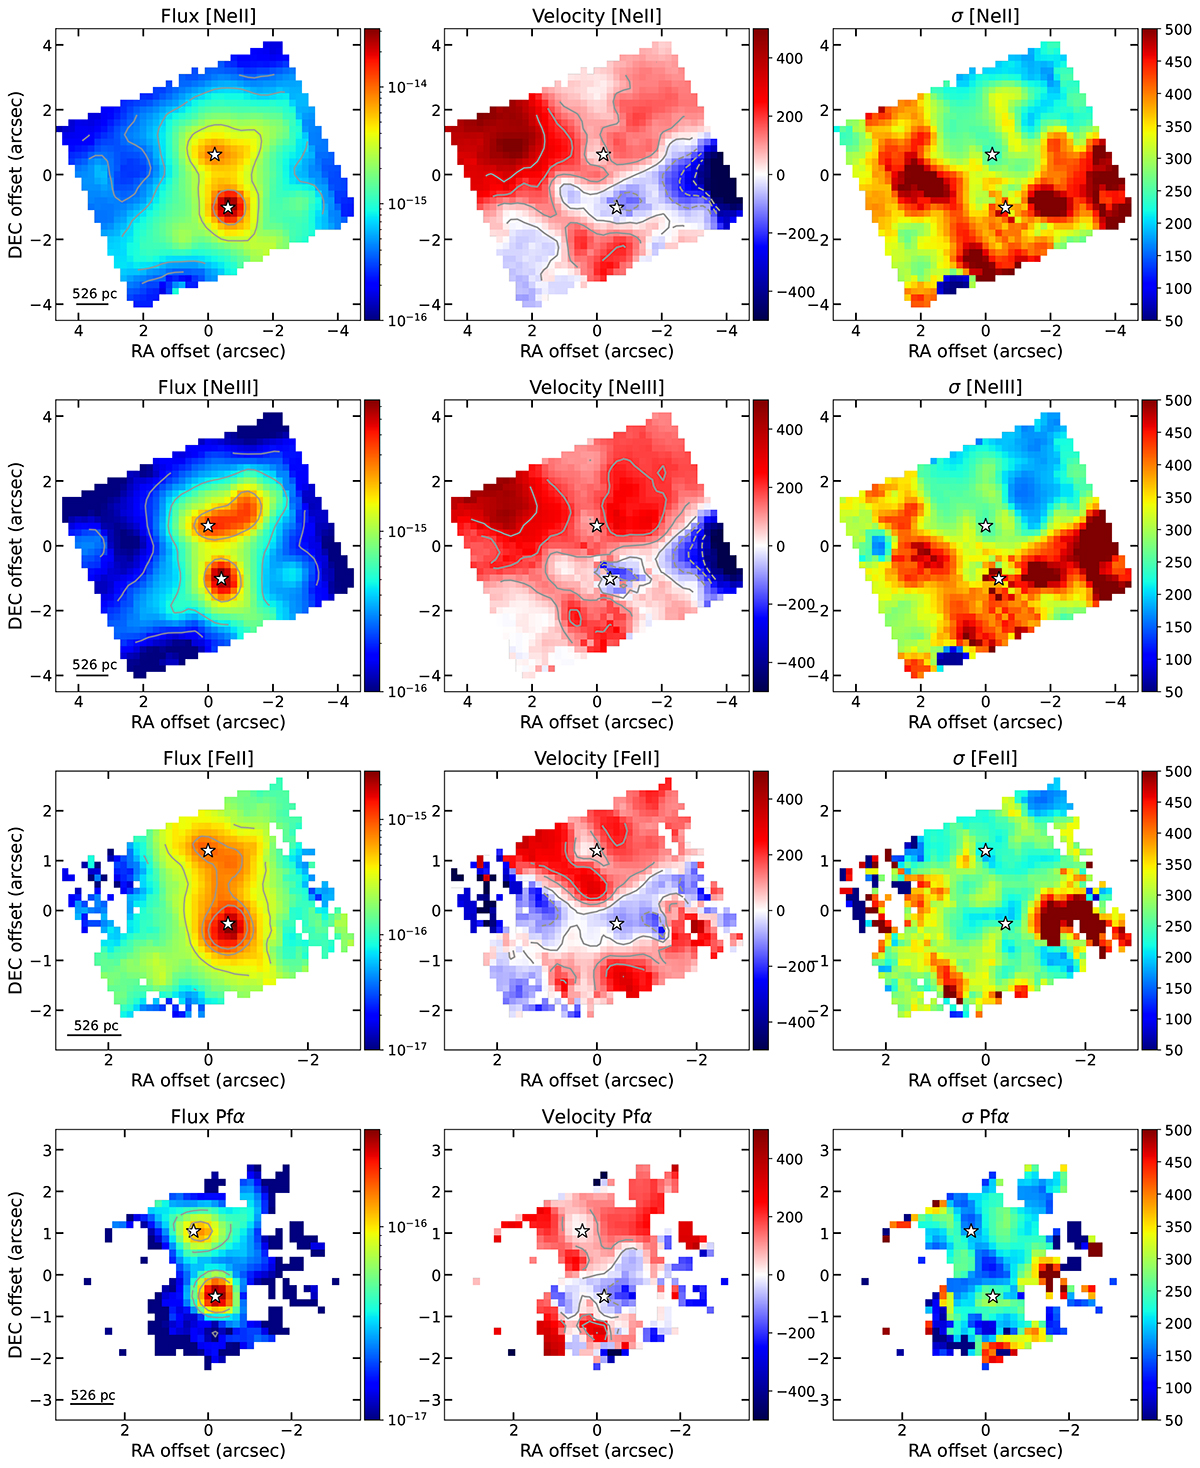
Fig. 4.
Download original image
Kinematic maps obtained with the modelling of a single Gaussian for the [Ne II], [Ne III], and [Fe II] at 5.34 μm and Pfα lines (from top to bottom, respectively). The latter line kinematics were obtained after re-binning the cube with a 2 × 2 box (see Sect. 2.2). From left to right: flux in erg s−1 cm−2, velocity in km s−1, and velocity dispersion in km s−1. The contours in the velocity maps go from −300 to 300 km s−1 (increments of 100 km s−1). The contours in the flux maps go from 10−16 to 10−14 erg s−1 cm−2 (divided in 5 contours), except for Pfα (from 10−17 to 10−15 erg s−1 cm−2). White stars indicate the photometric centre for both nuclei in their corresponding sub-channels, and the lower-left line indicate the 1″ physical scale. The (0, 0) point in each panel marks the centre of the FoV at each channel. For all maps, north is up and east to the left.
Current usage metrics show cumulative count of Article Views (full-text article views including HTML views, PDF and ePub downloads, according to the available data) and Abstracts Views on Vision4Press platform.
Data correspond to usage on the plateform after 2015. The current usage metrics is available 48-96 hours after online publication and is updated daily on week days.
Initial download of the metrics may take a while.