Fig. 3.
Download original image
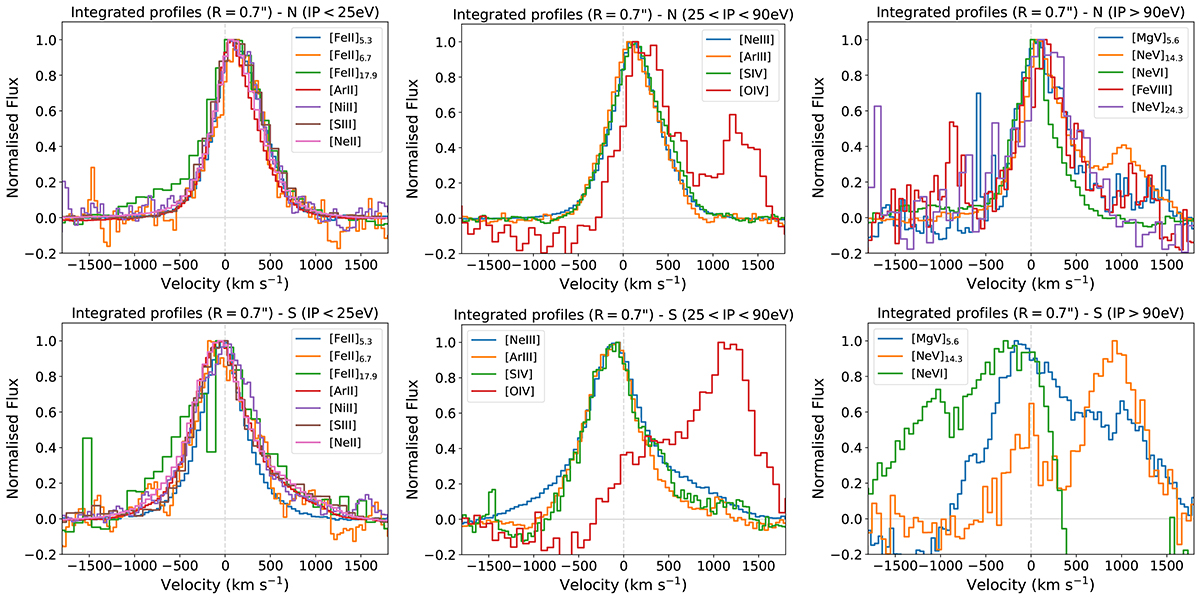
Integrated profiles (r = 0.7″) of all the emission lines detected in the northern (upper panels) and southern (bottom panels) nucleus, after applying the fringing correction (see Sect. 2.1), normalised to the maximum flux. The lines are separated by IP, left IP < 25 eV, middle 25 < IP < 90 eV, and right IP > 90 eV. The rest-frame velocity corresponding to a z = 0.02448 is indicated with a dashed, grey, vertical line. We note that [O IV] is blended with [Fe II] at 25.99 μm and [Ne V] with [Cl II] at 14.37 μm (middle and right panels, see Sect. 3.1). We note that in the lower-right panel, [Ne VI] and [Mg V] are embedded in PAH features, and thus they are not detected in the original integrated spectrum (see Sects. 3 and 4.2).
Current usage metrics show cumulative count of Article Views (full-text article views including HTML views, PDF and ePub downloads, according to the available data) and Abstracts Views on Vision4Press platform.
Data correspond to usage on the plateform after 2015. The current usage metrics is available 48-96 hours after online publication and is updated daily on week days.
Initial download of the metrics may take a while.