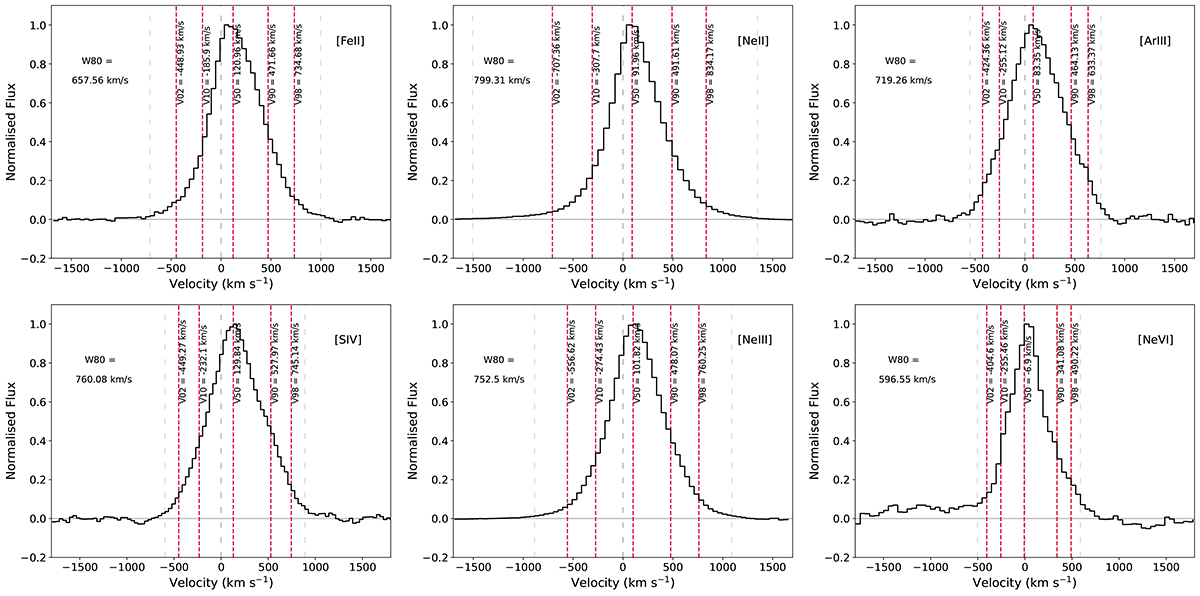
Fig. A.2.
Download original image
Non-parametric modelling for the integrated profiles of some ionised emission lines at different IP detected for the N nucleus assuming a radius of 0.7″. The flux has been normalised with the peak of the emission, and the wavelength has been transformed to velocity in km s−1 after redshift correction (see Sect. 1). In all panels the grey, dashed lines indicate the selected line limits, and the red, dashed lines mark the V02, V10, V50, V90 and V98 values (see Sect. 2). The labels indicate the line in each panel and the W80 parameter (see Sect. 2).
Current usage metrics show cumulative count of Article Views (full-text article views including HTML views, PDF and ePub downloads, according to the available data) and Abstracts Views on Vision4Press platform.
Data correspond to usage on the plateform after 2015. The current usage metrics is available 48-96 hours after online publication and is updated daily on week days.
Initial download of the metrics may take a while.