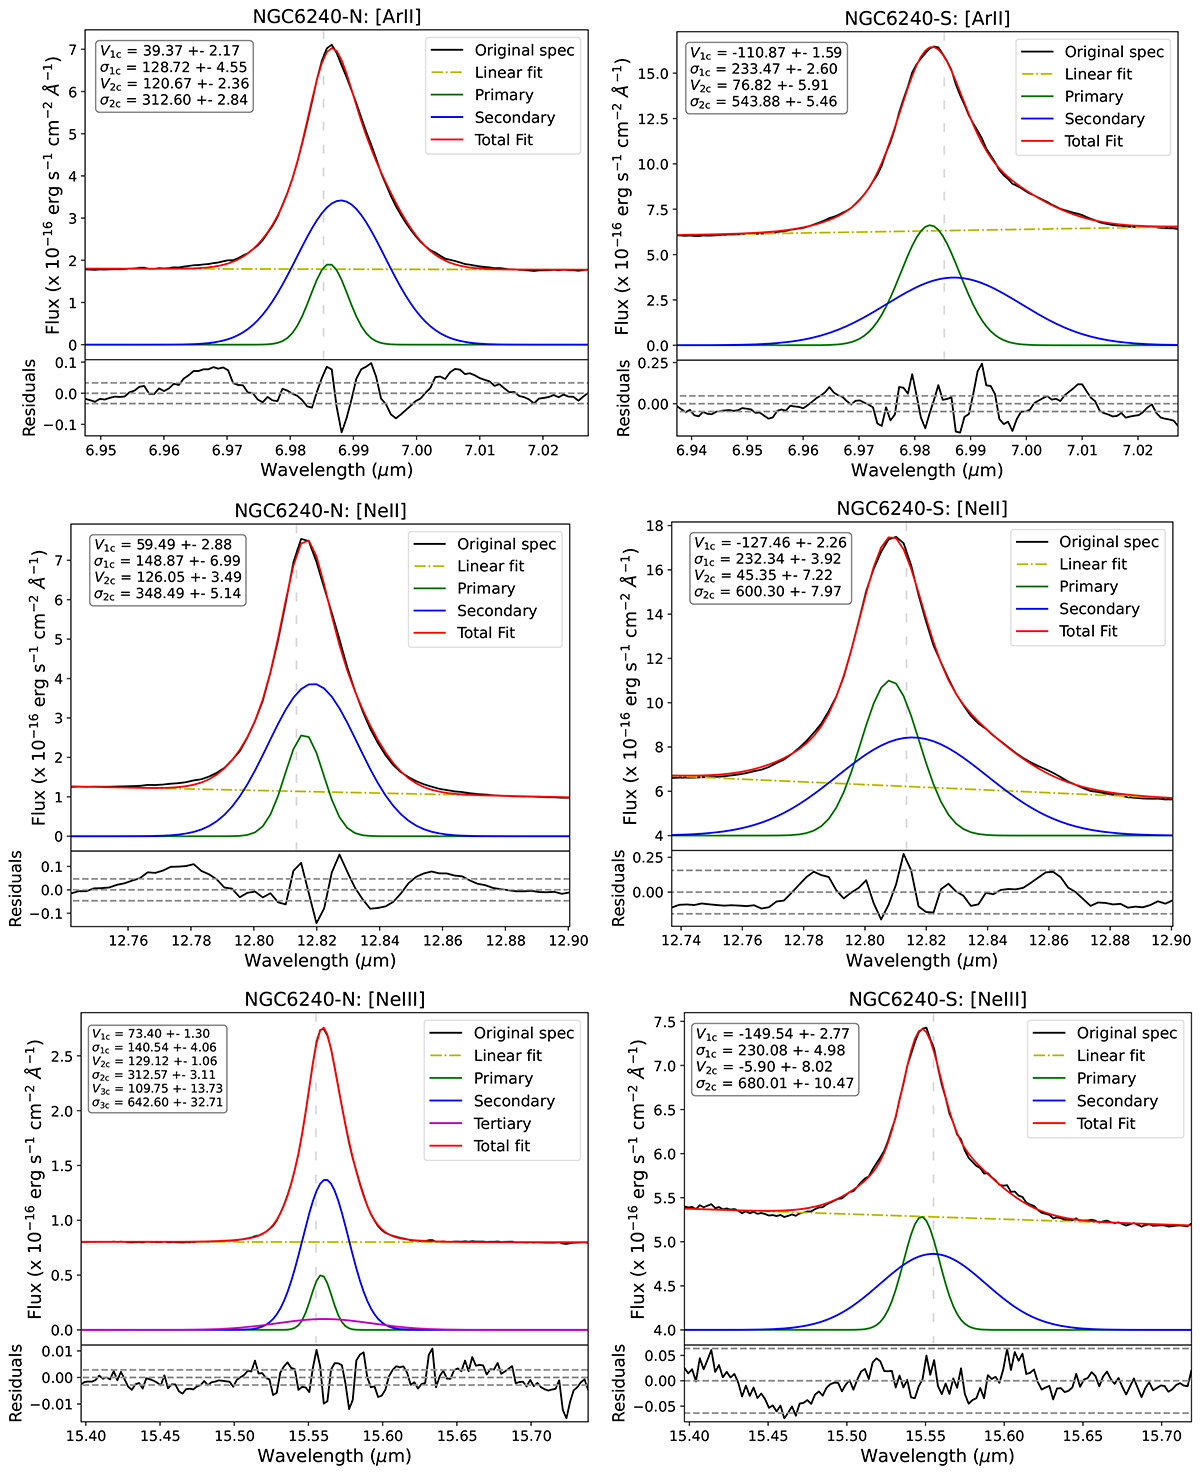
Fig. A.1.

Download original image
Parametric modelling of the most complex emission lines (from top to bottom, [Ar II], [Ne II], and [Ne III]) for the integrated spectra (R∼0.7″) both the N (left panels) and S (right panels) nucleus. The main part of the figure for all panels represent the original spectrum in black, the linear fit as the dashed, yellow line, and the total final modelling as the red line. The different Gaussian components are represented in green (primary), blue (secondary), and magenta (tertiary), when present. The rest-frame position is marked with a dashed, grey, vertical line at the corresponding wavelength in all panels. The bottom part of the figures show the residuals of the fit in black, with the 3σ limits as dashed, grey lines (see details in Sect. 2.2 and Hermosa Muñoz et al. 2024a). The velocity (corrected for the systemic value) and the velocity dispersion (corrected for the instrumental value) of every component are marked for each line.
Current usage metrics show cumulative count of Article Views (full-text article views including HTML views, PDF and ePub downloads, according to the available data) and Abstracts Views on Vision4Press platform.
Data correspond to usage on the plateform after 2015. The current usage metrics is available 48-96 hours after online publication and is updated daily on week days.
Initial download of the metrics may take a while.


