Fig. 10.
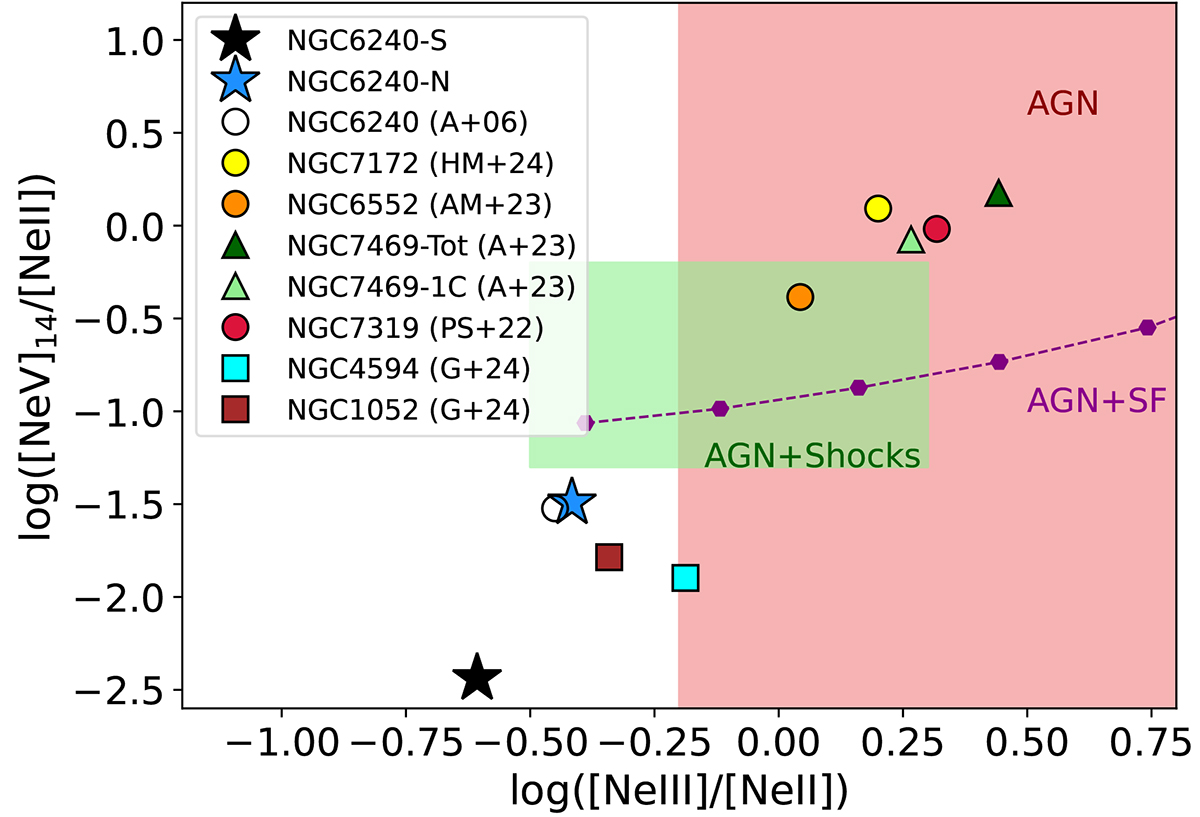
Download original image
Mid-IR diagnostic diagram representing log([Ne V]/[Ne II]) versus log([Ne III]/[Ne II]) to divide between AGN (red area), shocks (green area), and SF (purple line) ionisation based on Fig. 5 in Feltre et al. (2023). The shaded areas schematically represent part of the grid of models in Feltre et al. (2023), and are used here just as a reference. We represent with a blue and a black star the position of the N and S nucleus, respectively (see Sect. 3.3). For comparison, we show the integrated value derived by Armus et al. (2006) for NGC 6240 as a white circle, and the nuclear values obtained with similar JWST data for other local type-2 Seyfert galaxies: yellow circle for NGC 7172 (Hermosa Muñoz et al. 2024b), orange circle for NGC 6552 (Álvarez-Márquez et al. 2023), dark (light) green triangles for the total (primary component) flux of the line for the type-1.5 Seyfert NGC 7469 (Armus et al. 2023), and red circle for NGC 7319 (Pereira-Santaella et al. 2022). Additionally, we show the ratios for two LINERs, namely NGC 4594 and NGC 1052, as a blue and brown squares, respectively (Goold et al. 2024).
Current usage metrics show cumulative count of Article Views (full-text article views including HTML views, PDF and ePub downloads, according to the available data) and Abstracts Views on Vision4Press platform.
Data correspond to usage on the plateform after 2015. The current usage metrics is available 48-96 hours after online publication and is updated daily on week days.
Initial download of the metrics may take a while.