Fig. 1.
Download original image
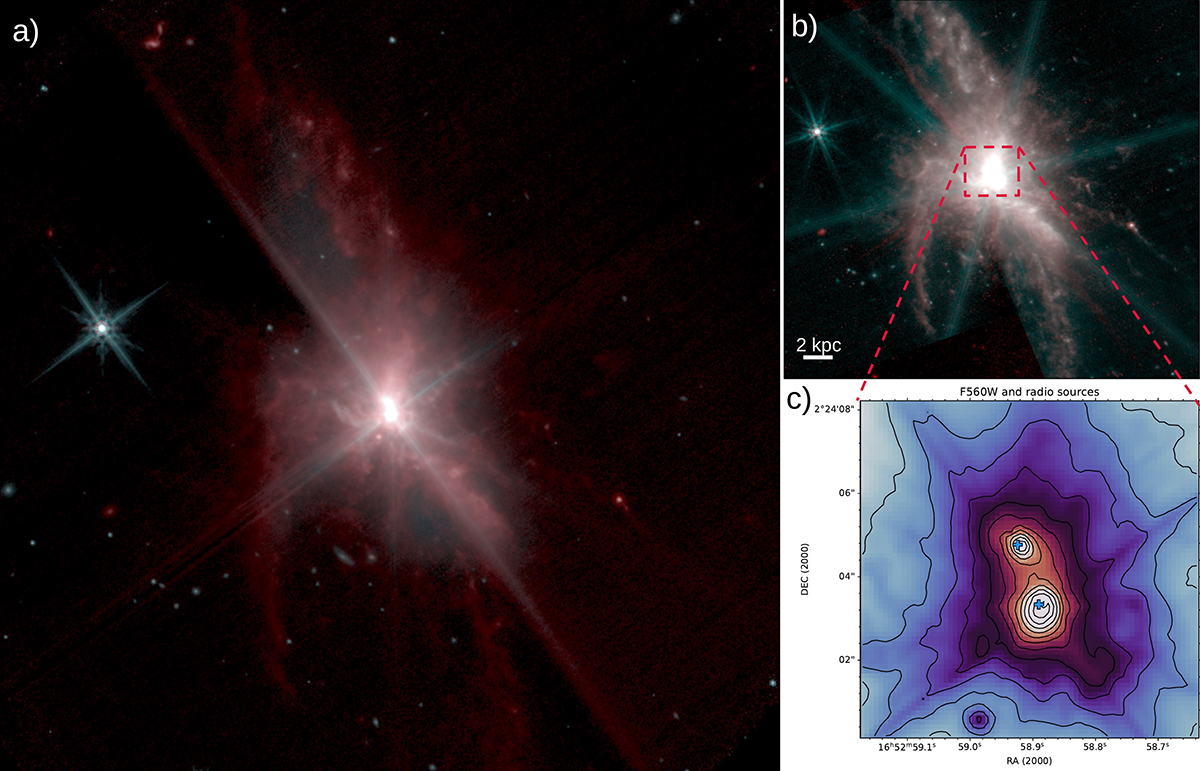
False-colour images of NGC 6240 produced combining the MIRI images (see Sect. 2 for the details). Image a was obtained with the filters F560W and F1130W within an approximate FoV of 90″ × 90″ (1″ = 526 pc). Image b was obtained with the filters F770W and F1130W within an approximate FoV of 80″ × 80″ and the nuclei saturated to highlight the low-level structure. Panel c shows a zoom-in (approximate FoV of 7″ × 8″) to the F560W-filter image in logarithm scale with the position of the two radio sources in Gallimore & Beswick (2004) marked as blue crosses. The twelve contour levels in panel c go from 0.2% up to 73% of the flux peak, also in logarithm scale. We note that the diffraction spikes produced by the unresolved component of both nuclei have not been corrected. In all panels, north is up and east to the left.
Current usage metrics show cumulative count of Article Views (full-text article views including HTML views, PDF and ePub downloads, according to the available data) and Abstracts Views on Vision4Press platform.
Data correspond to usage on the plateform after 2015. The current usage metrics is available 48-96 hours after online publication and is updated daily on week days.
Initial download of the metrics may take a while.