Fig. 2.
Download original image
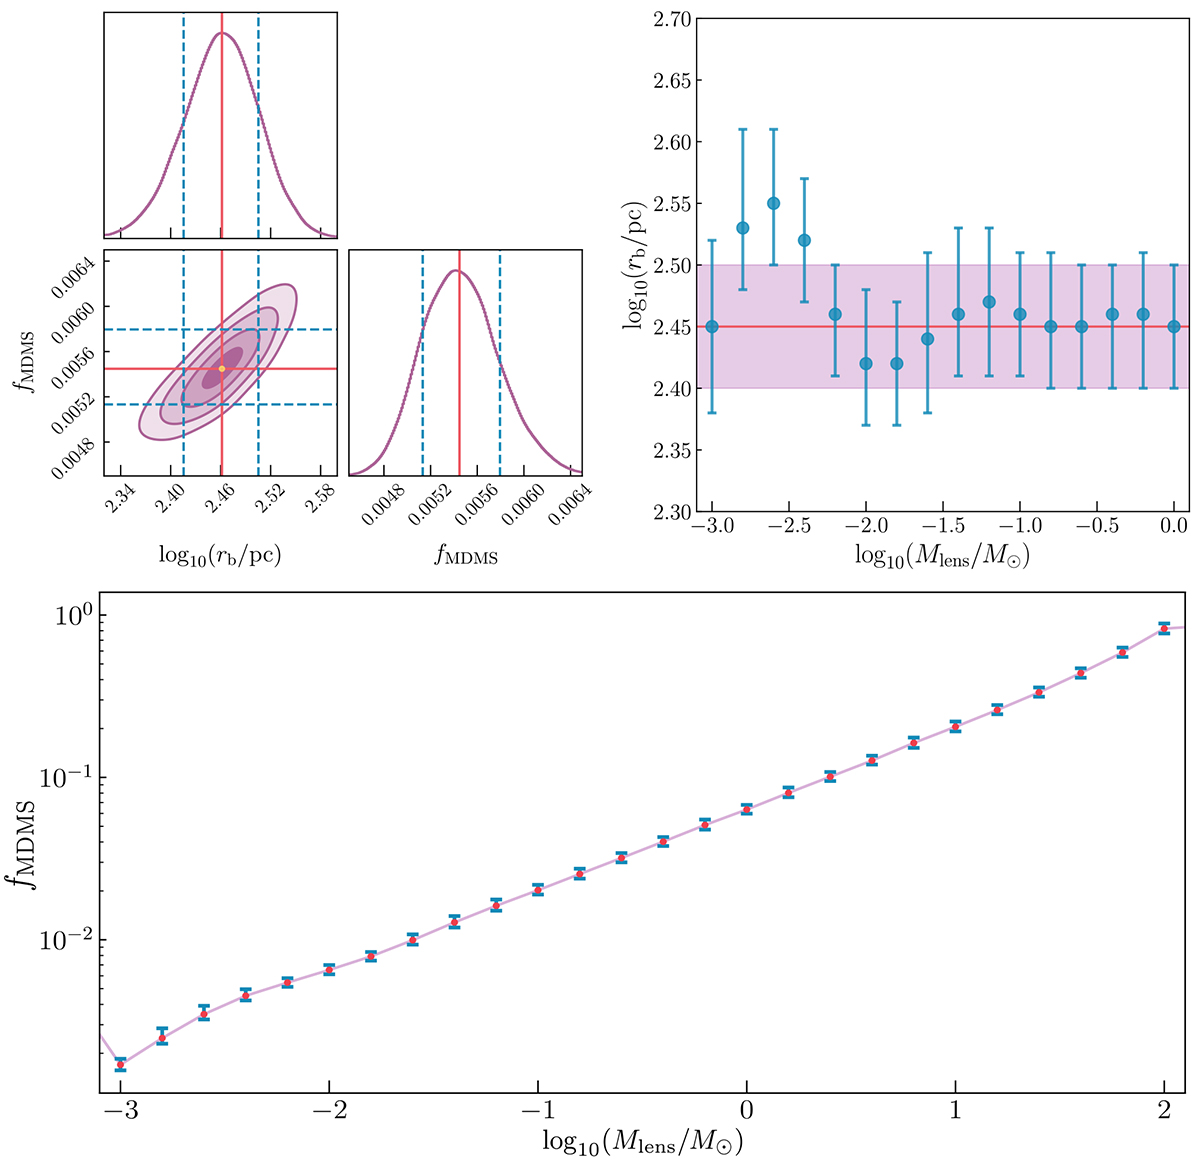
These figure generalize the major results of the constraints on the fraction of MDMS, the core size of the Milky Way dark matter halo as well as the lens mass independence of the core size. Top left: corner plot of the two parameters fMDMS and core size rb with a lens mass of 10−2.2 M⊙. The solid red lines show the median value of the posterior distribution, and the dashed blue lines denote the 68% confidence interval. The yellow point shows the median value of the MCMC sampled posterior, and the different contours in the corner plot denote the different σ levels. Top right: core size as a function of the lens masses. The solid red line shows the median value from the left panel for rb, and the one σ range is plotted as the purple belt. The different core sizes sampled from different lens masses are shown as data points with error bars. The value remains almost unchanged within the one σ level. Bottom: fraction of MDMS fMDMS from the MCMC as function of the lens masses. The red points show the median, and the blue error bars show the one sigma range for each mass value. The solid purple line connects the median values.
Current usage metrics show cumulative count of Article Views (full-text article views including HTML views, PDF and ePub downloads, according to the available data) and Abstracts Views on Vision4Press platform.
Data correspond to usage on the plateform after 2015. The current usage metrics is available 48-96 hours after online publication and is updated daily on week days.
Initial download of the metrics may take a while.