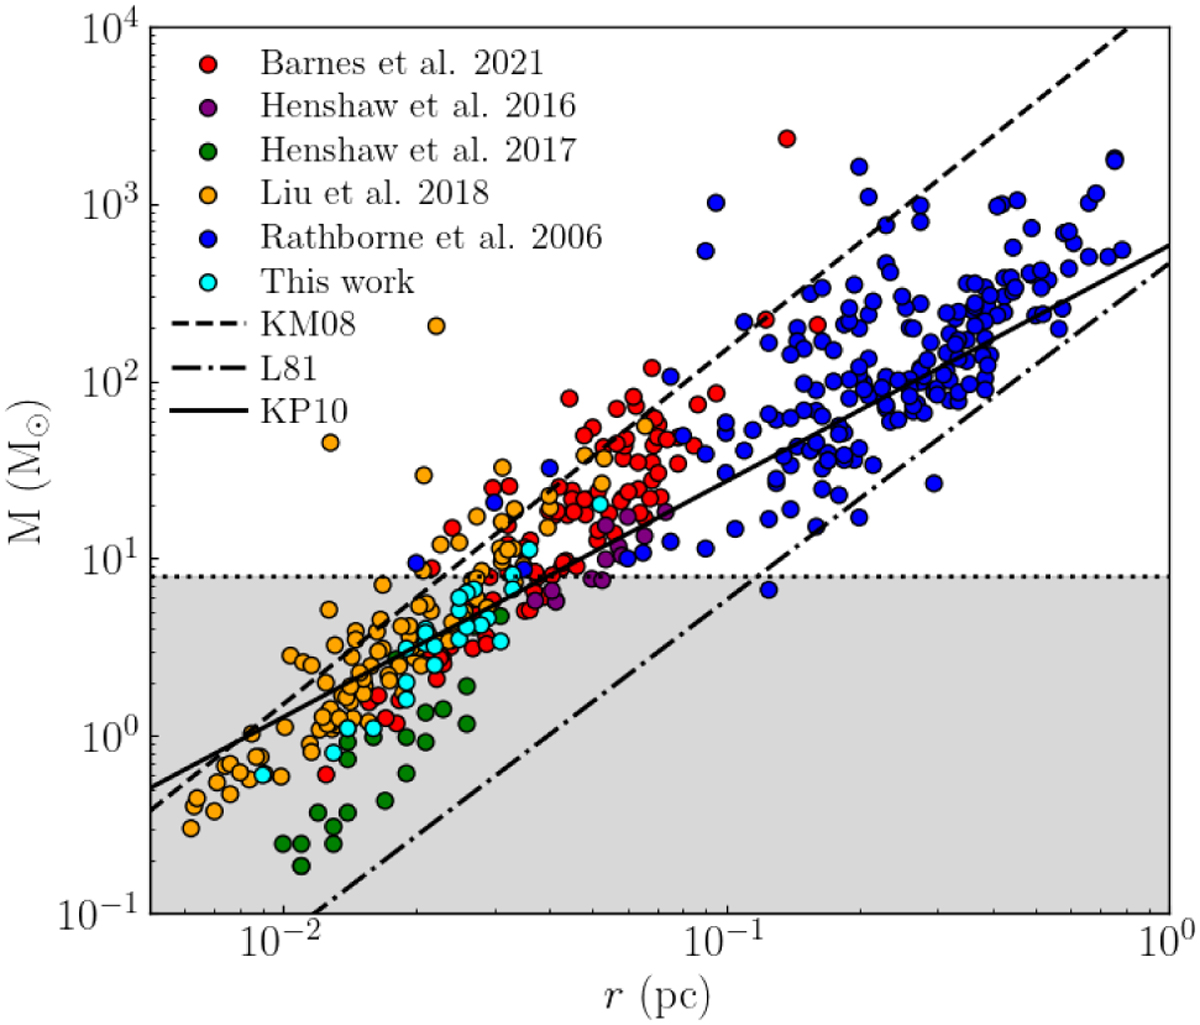
Fig. 7
Download original image
Core masses as a function of sizes for the cores identified in this this work (cyan dots). For comparison, the mass and the sizes of the cores and/or clumps determined by Rathborne et al. (2006); Henshaw et al. (2016, 2017); Liu et al. (2018); Barnes et al. (2021) and homogenised by Barnes et al. (2021) are reported as coloured dots. Overlaid as the diagonal black lines are the mass–radius relations taken from (Larson 1981, L81; dash-dotted line), the high-mass star formation thresholds taken from (Krumholz & McKee 2008, KM08; dashed line) and (Kauffmann et al. 2010, KP10; solid line). The KP10 relation has been scaled by a factor of 1.5 to match the dust opacity used in Barnes et al. (2021). The horizontal dotted black line shows the mass threshold of high-mass stars (>8 M⊙).
Current usage metrics show cumulative count of Article Views (full-text article views including HTML views, PDF and ePub downloads, according to the available data) and Abstracts Views on Vision4Press platform.
Data correspond to usage on the plateform after 2015. The current usage metrics is available 48-96 hours after online publication and is updated daily on week days.
Initial download of the metrics may take a while.