Fig. 5
Download original image
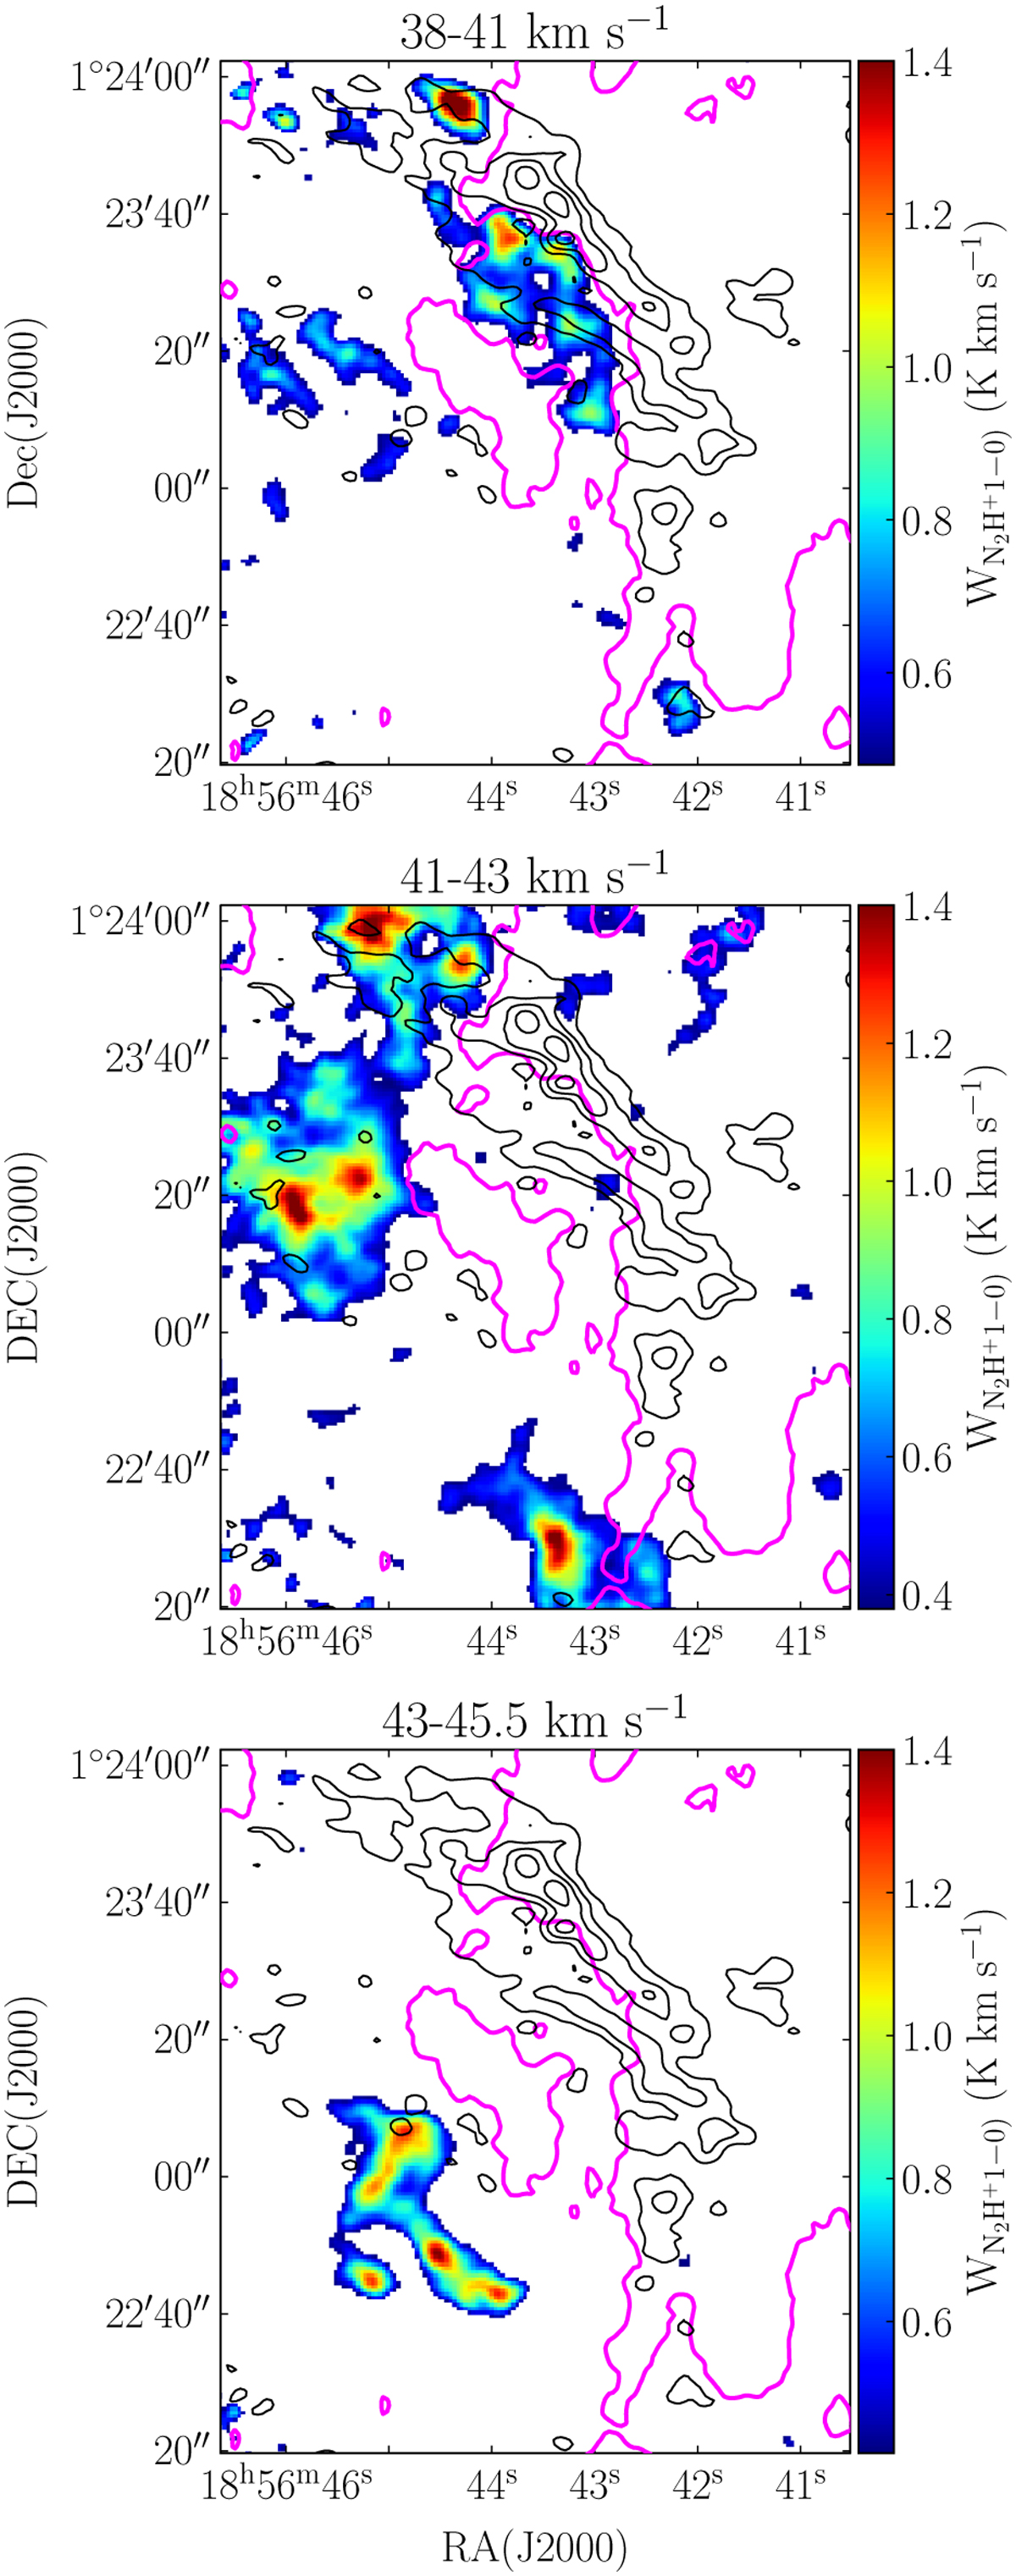
Integrated intensity maps of the N2H+(1–0) emission for the three identified velocity components, i.e. 38–41 km s−1 (top panel; Arms=0.16 K), 41–43 km s−1 (middle panel; Arms=0.13 K), and 43–45.5 km s−1 (bottom panel; Arms=0.14 K). In all panels, the pixels below 3×Arms have been masked. The ![]() (visual extinction 20 mag) magenta contour highlights the shape of the cloud (Kainulainen & Tan 2013). The SiO(2–1) emission (Cosentino et al. 2019) is shown as black contours from 3σ (σ=0.016 Jy beam−1 km s−1) in steps of 3σ.
(visual extinction 20 mag) magenta contour highlights the shape of the cloud (Kainulainen & Tan 2013). The SiO(2–1) emission (Cosentino et al. 2019) is shown as black contours from 3σ (σ=0.016 Jy beam−1 km s−1) in steps of 3σ.
Current usage metrics show cumulative count of Article Views (full-text article views including HTML views, PDF and ePub downloads, according to the available data) and Abstracts Views on Vision4Press platform.
Data correspond to usage on the plateform after 2015. The current usage metrics is available 48-96 hours after online publication and is updated daily on week days.
Initial download of the metrics may take a while.