Fig. 6.
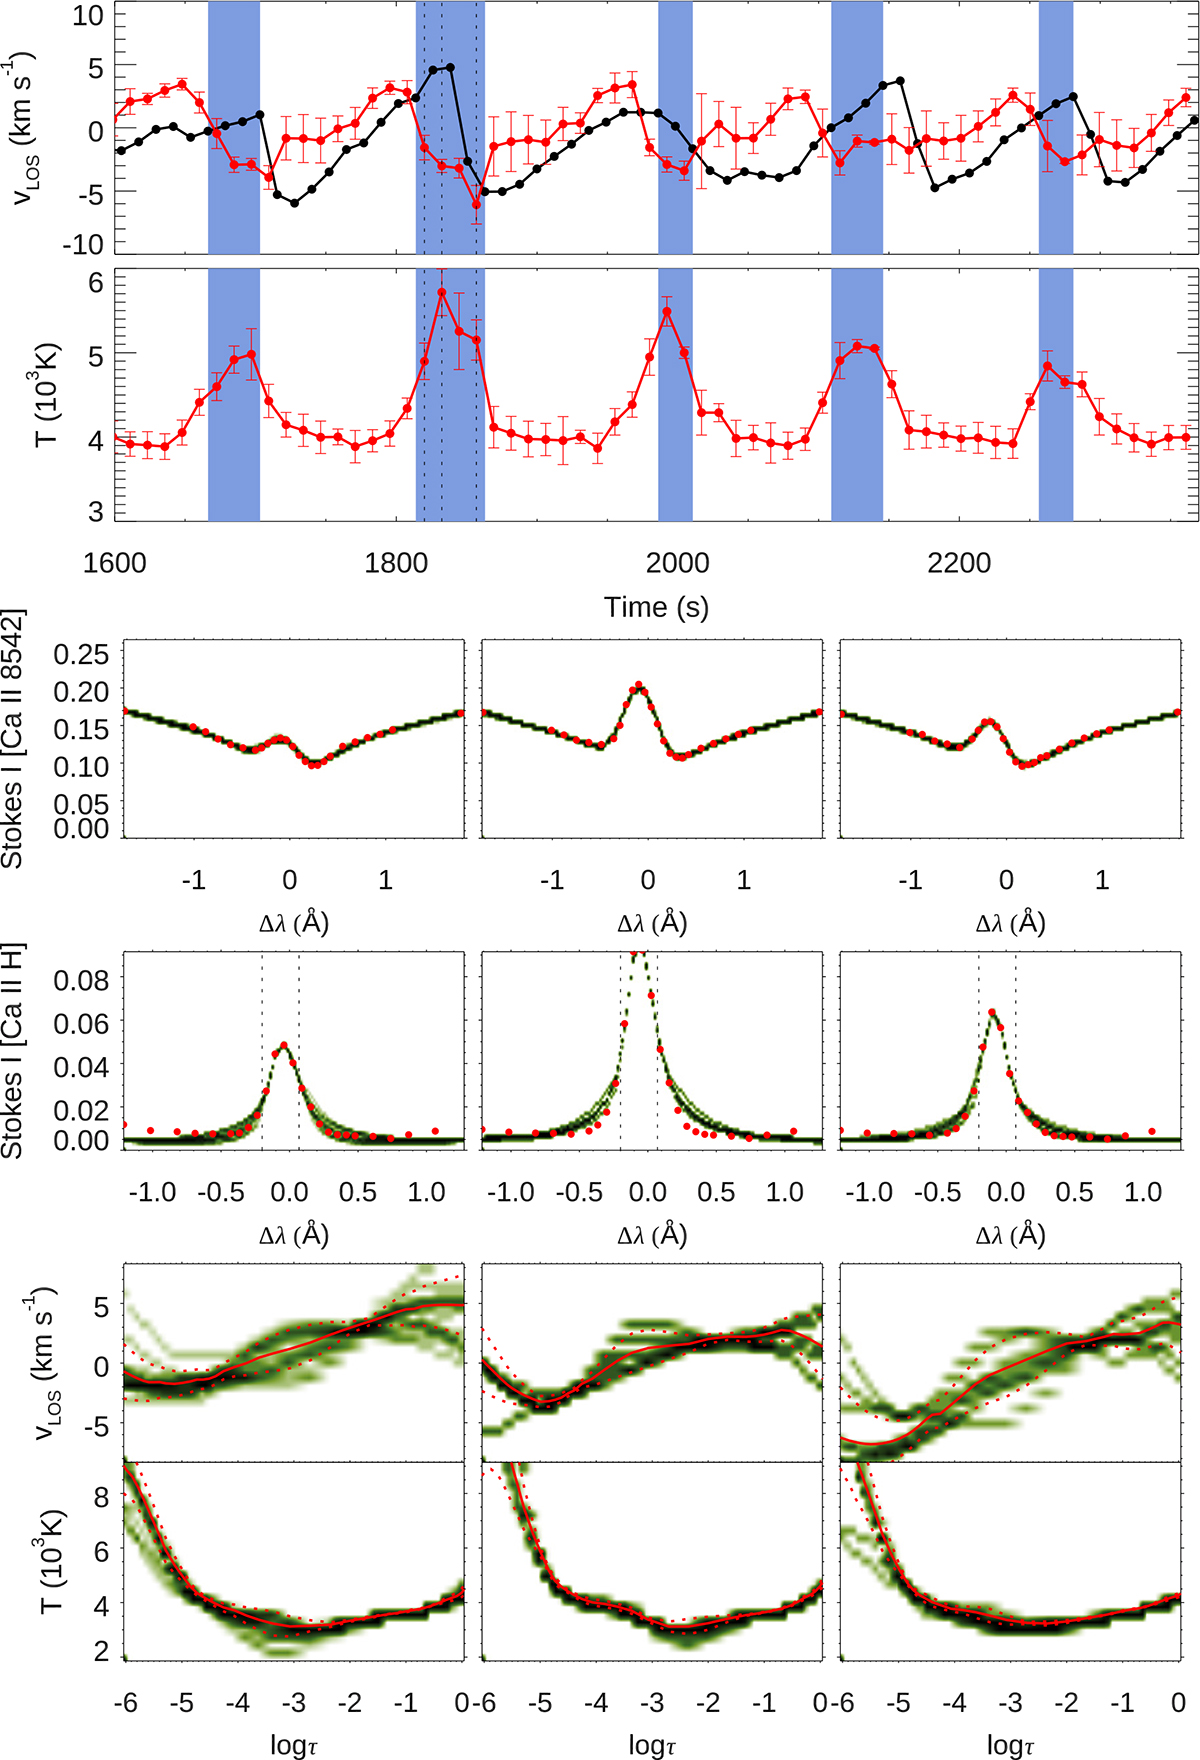
Download original image
Temporal evolution of the chromospheric fluctuations and inversion results at point A from Fig. 2, where propagating waves are found in the low chromosphere. Top panel: chromospheric velocity inferred from the multiline inversions of the Ca II lines (red line) and from Hα (black line). The inverted velocity corresponds to the median of the set of best inversions (out of 256 independent inversions) averaged in the optical depths between log τ = −4.6 and log τ = −5.3. The error bars indicate the standard deviation of the set of best inversions. Second panel: chromospheric temperature inferred from the inversion of the Ca II lines. The median temperature and error bars were determined similarly to the velocity. Middle panels: intensity of the Ca II 8542 Å (third row) and the Ca II H (fourth row) lines at three time steps indicated by vertical dashed lines in the top two panels. Bottom panels: inversion results for the velocity (fifth row) and temperature (last row) for the three selected time steps. The green color scale has the same meaning as in Fig. 4.
Current usage metrics show cumulative count of Article Views (full-text article views including HTML views, PDF and ePub downloads, according to the available data) and Abstracts Views on Vision4Press platform.
Data correspond to usage on the plateform after 2015. The current usage metrics is available 48-96 hours after online publication and is updated daily on week days.
Initial download of the metrics may take a while.