Fig. 4.
Download original image
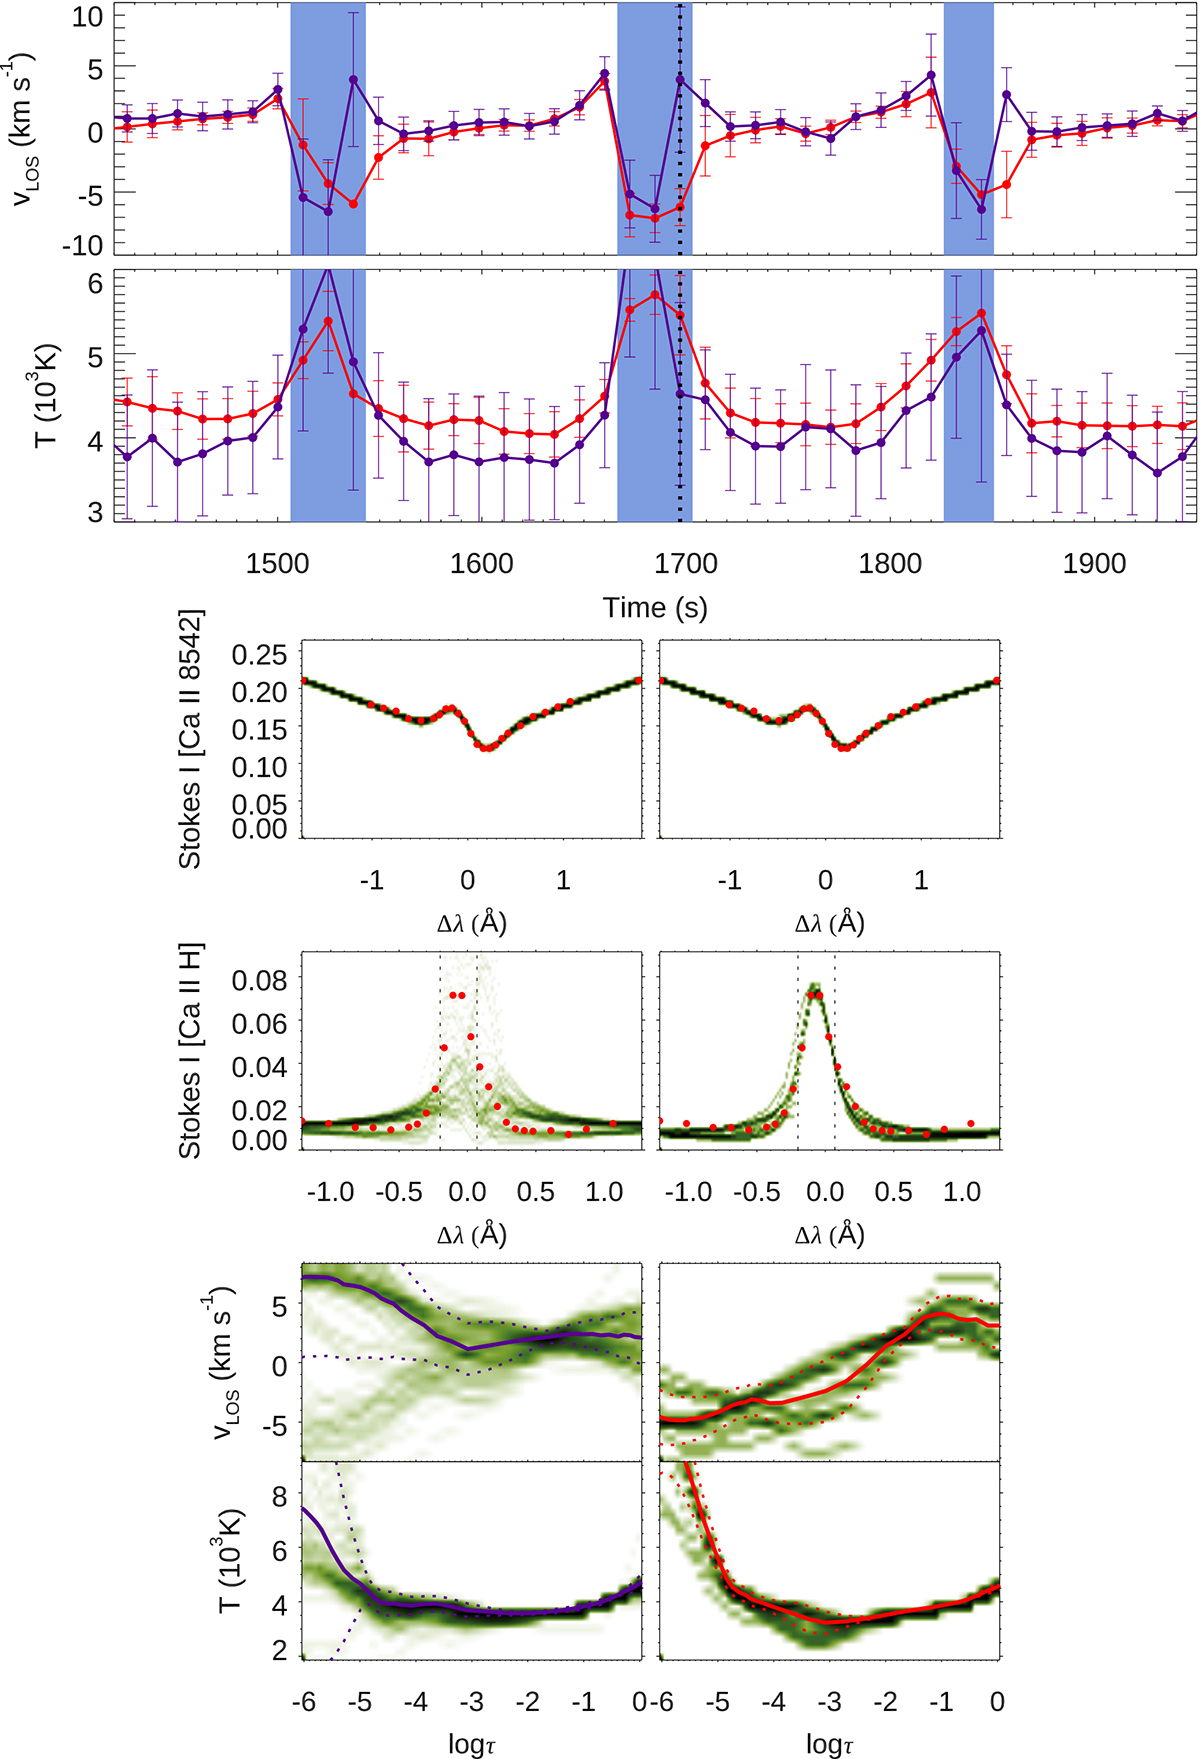
Comparison of single-line inversions of the Ca II 8542 Å and multiline inversions of that line together with the core of the Ca II H at a randomly chosen umbral location. Top panel: temporal evolution of the chromospheric velocity inferred from multiline (red line) and single-line (violet) inversions. The velocity value is given by the median of the set of best inversions from the 256 independent inversions performed for each spectral profile. The error indicates the standard deviation of that set. Second panel: same as the top panel, but for the temperature. In the top two panels, the blue shaded areas indicate the times when the Ca II 8542 Å profile exhibits an umbral flash. The vertical dotted line at t = 1697 s marks the time illustrated in the bottom panels. Four bottom rows: inversion results for the single-line (left column) and multiline (right column) inversions. The top two rows illustrate the observed line profiles (red dots) and the fit of the inversions. The bottom two rows correspond to the stratification of the velocity and temperature inferred from the inversions. In all these panels, the green color scale indicates how common a solution is in the set of best inversions (a darker color corresponds to a more common solution). In the bottom two rows, the solid lines illustrate the median solution from the set of best inversions, and the dotted lines indicate the standard deviation.
Current usage metrics show cumulative count of Article Views (full-text article views including HTML views, PDF and ePub downloads, according to the available data) and Abstracts Views on Vision4Press platform.
Data correspond to usage on the plateform after 2015. The current usage metrics is available 48-96 hours after online publication and is updated daily on week days.
Initial download of the metrics may take a while.