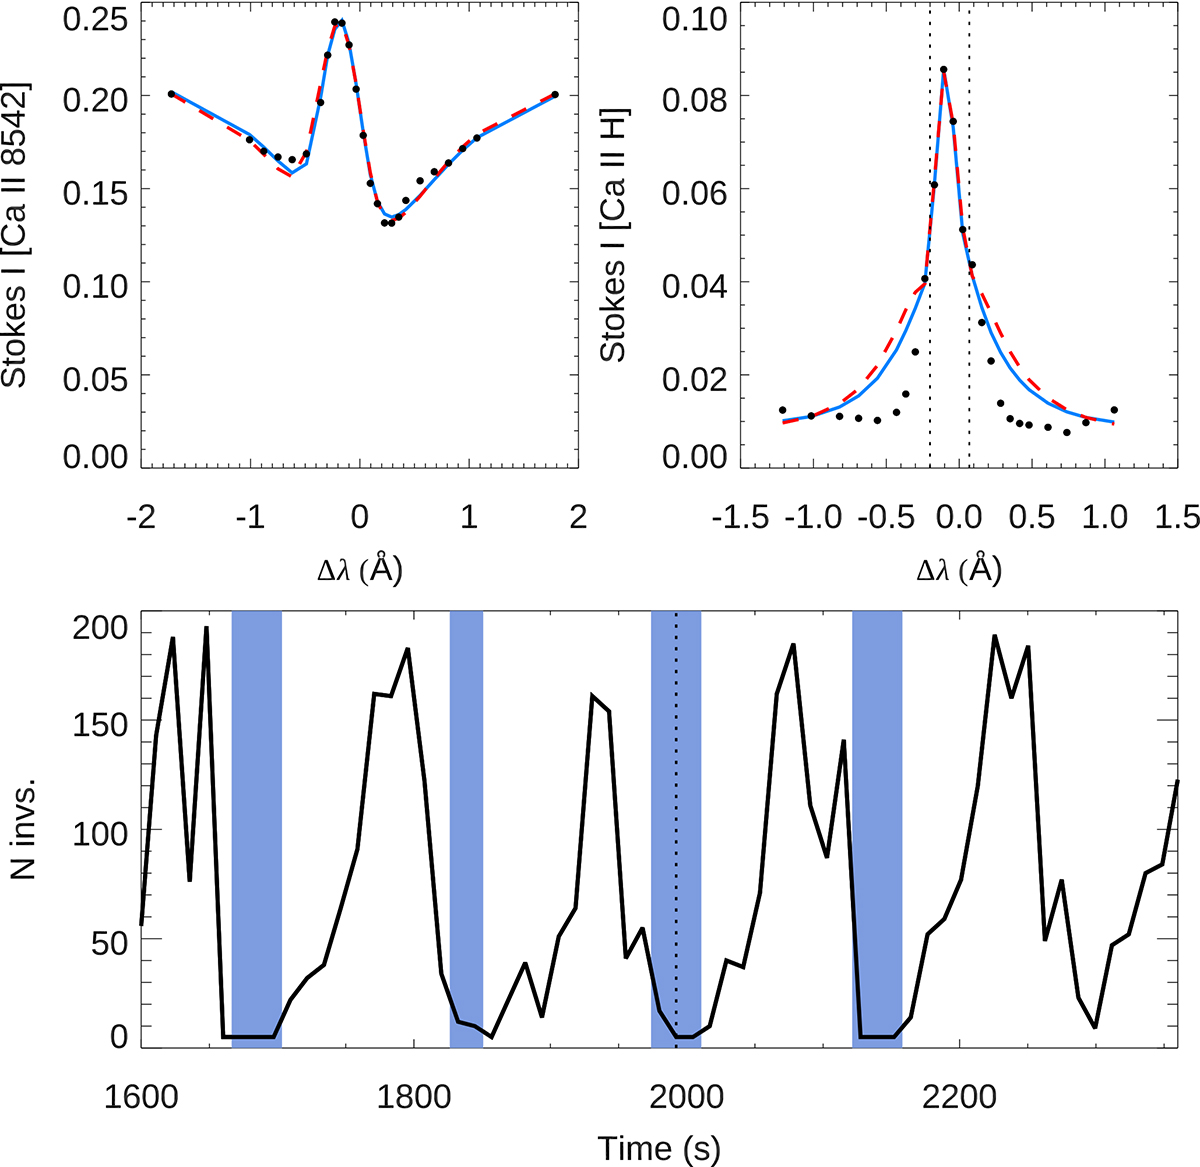
Fig. 3.
Download original image
Quality of the inversion fits and number of inversions that satisfy the threshold criterion. Top panels: observed umbral flash profile (black dots), the fit obtained from an inversion whose χ2 is near the chosen threshold (solid blue line), and the fit of the inversion with the worst χ2 (above the threshold) that was included in the analysis (dashed red line). The left panel corresponds to the Ca II 8542 Å line, and the right panel shows the Ca II H line. The vertical dotted lines in the right panel delimit the line core region we employed in the inversions. Bottom panel: temporal evolution of the number of inversions employed for the analysis of each profile at a selected umbral location. The blue shaded areas indicate the temporal steps when the core of the Ca II 8542 Å is in emission. The vertical dotted line corresponds to the time step illustrated in the top panels.
Current usage metrics show cumulative count of Article Views (full-text article views including HTML views, PDF and ePub downloads, according to the available data) and Abstracts Views on Vision4Press platform.
Data correspond to usage on the plateform after 2015. The current usage metrics is available 48-96 hours after online publication and is updated daily on week days.
Initial download of the metrics may take a while.