Fig. 2.
Download original image
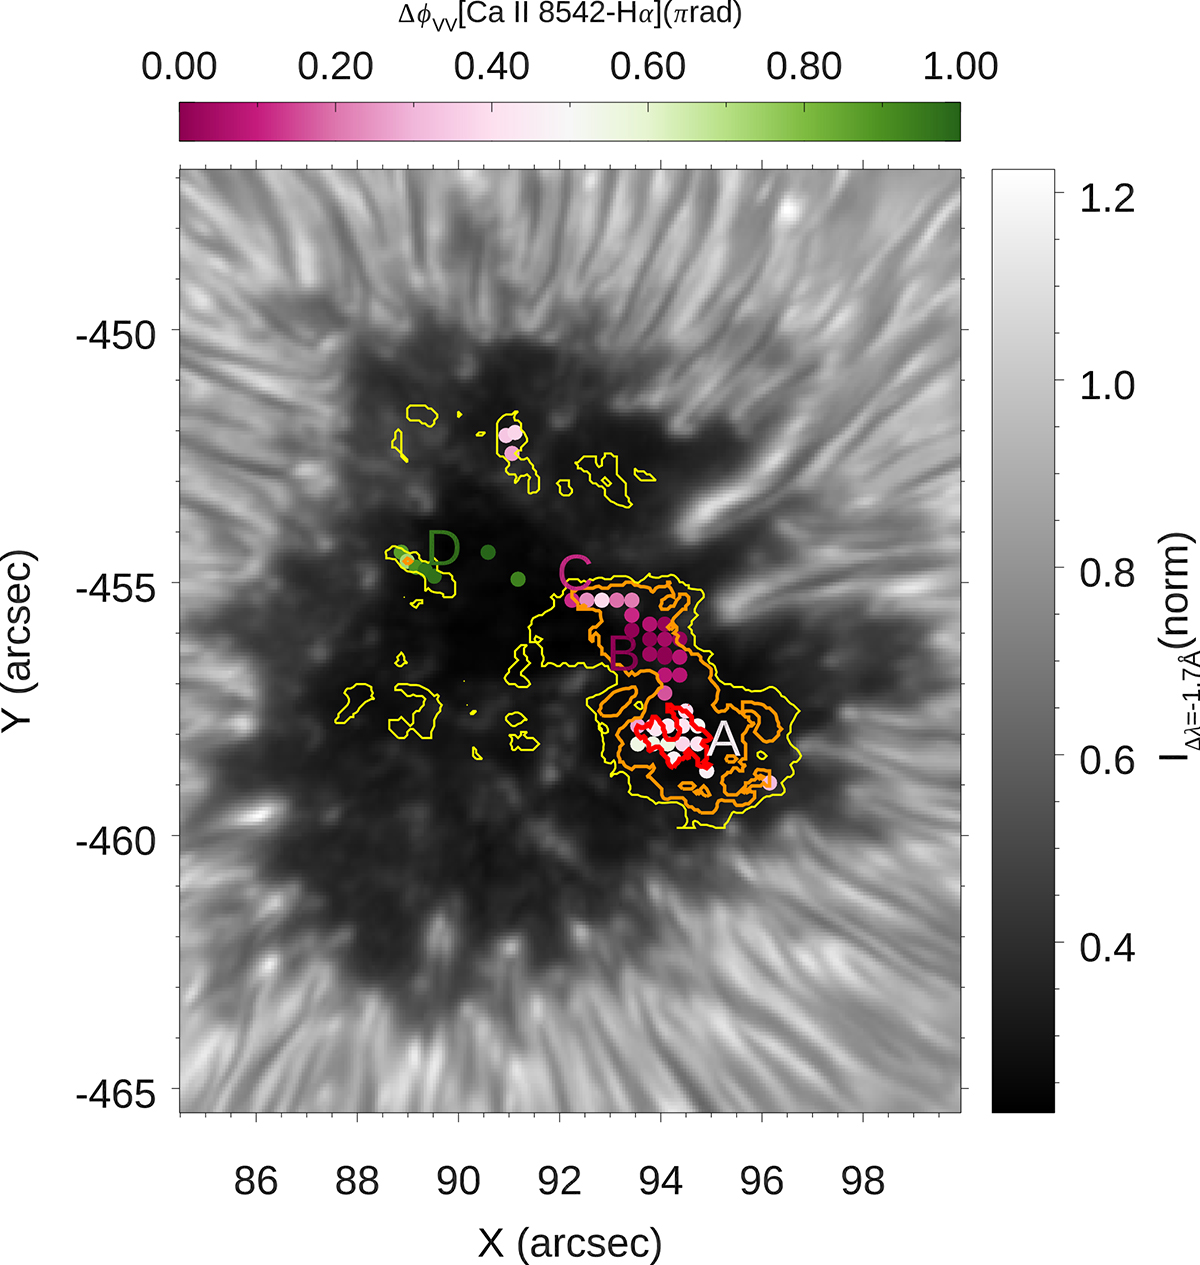
V-V phase shift between the Ca II and Hα chromospheric velocities at the analyzed locations. The background shows an intensity map of the umbra and surroundings at the continuum around the Ca II 8542 Å line. The colored dots mark the analyzed locations, and the color corresponds to the V-V phase shift at 6.45 mHz according to the upper color bar. The contours indicate the number of umbral flash profiles as described in Fig. 1. The letters A-D indicate the locations illustrated in Figs. 6, 8, 9, and 10.
Current usage metrics show cumulative count of Article Views (full-text article views including HTML views, PDF and ePub downloads, according to the available data) and Abstracts Views on Vision4Press platform.
Data correspond to usage on the plateform after 2015. The current usage metrics is available 48-96 hours after online publication and is updated daily on week days.
Initial download of the metrics may take a while.