Fig. 1.
Download original image
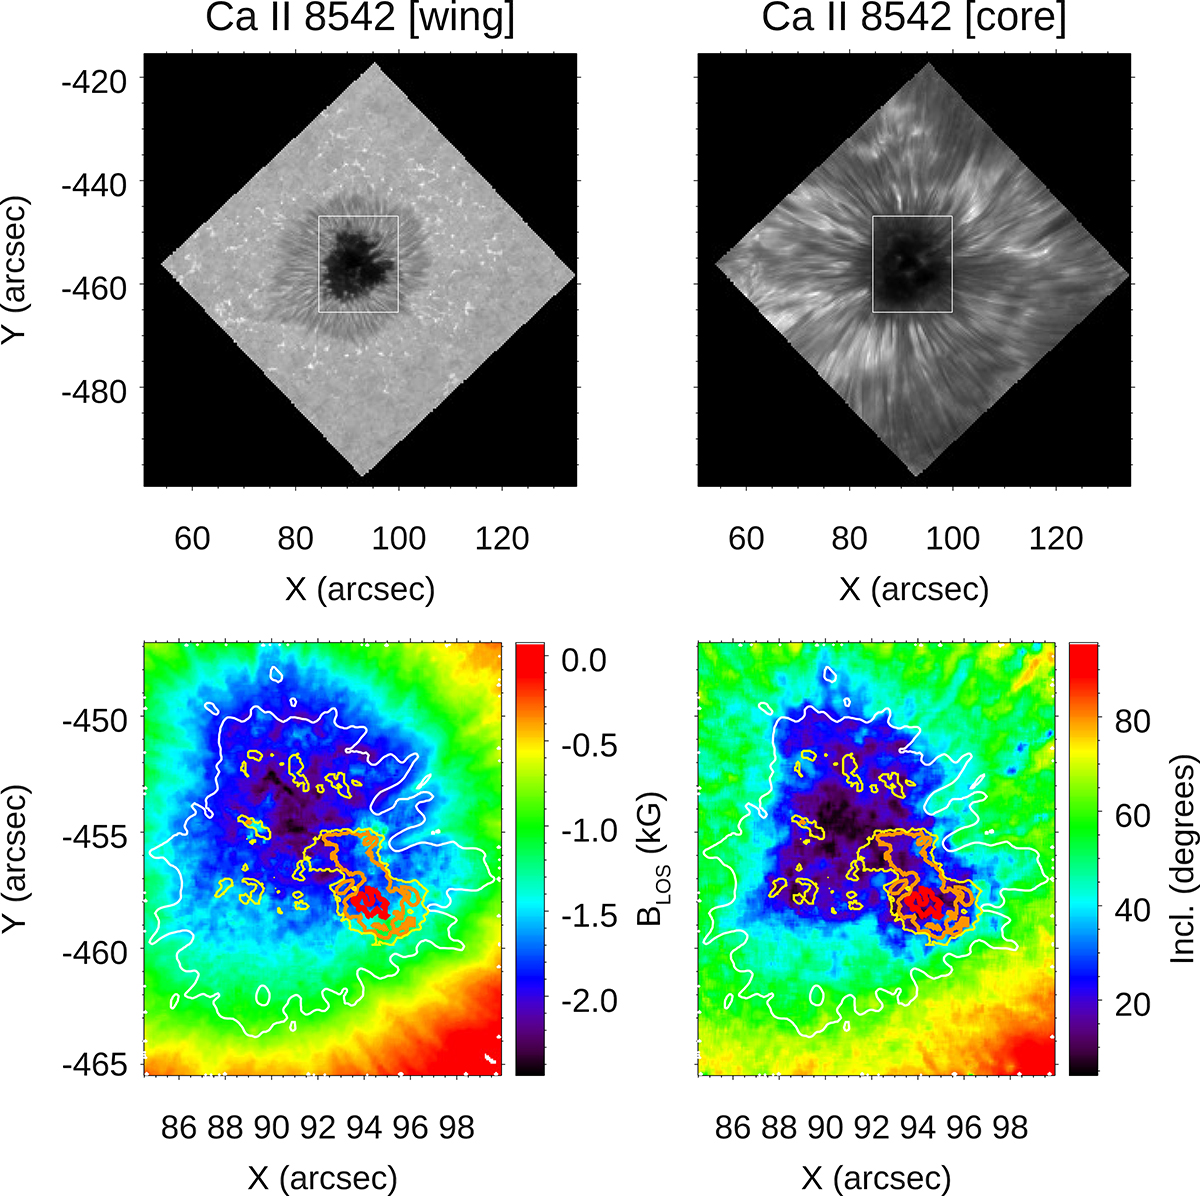
Field of view of the observations and magnetic field inferred from the inversions of the polarimetric map. Top panels: intensity in the wing (left panel) and core (right panel) of the Ca II 8542 Å line. The white square delimits the region in which the spectropolarimetric inversions were performed. Bottom panels: line-of-sight magnetic field (left panel) and magnetic field inclination (right panel). The white contours mark the boundary between the umbra and penumbra. The red, orange, and yellow contours delimit the regions in which 14, 7, and 3 umbral flash profiles, respectively, were detected during the 13 min of the temporal series that we analyzed.
Current usage metrics show cumulative count of Article Views (full-text article views including HTML views, PDF and ePub downloads, according to the available data) and Abstracts Views on Vision4Press platform.
Data correspond to usage on the plateform after 2015. The current usage metrics is available 48-96 hours after online publication and is updated daily on week days.
Initial download of the metrics may take a while.