Fig. 9
Download original image
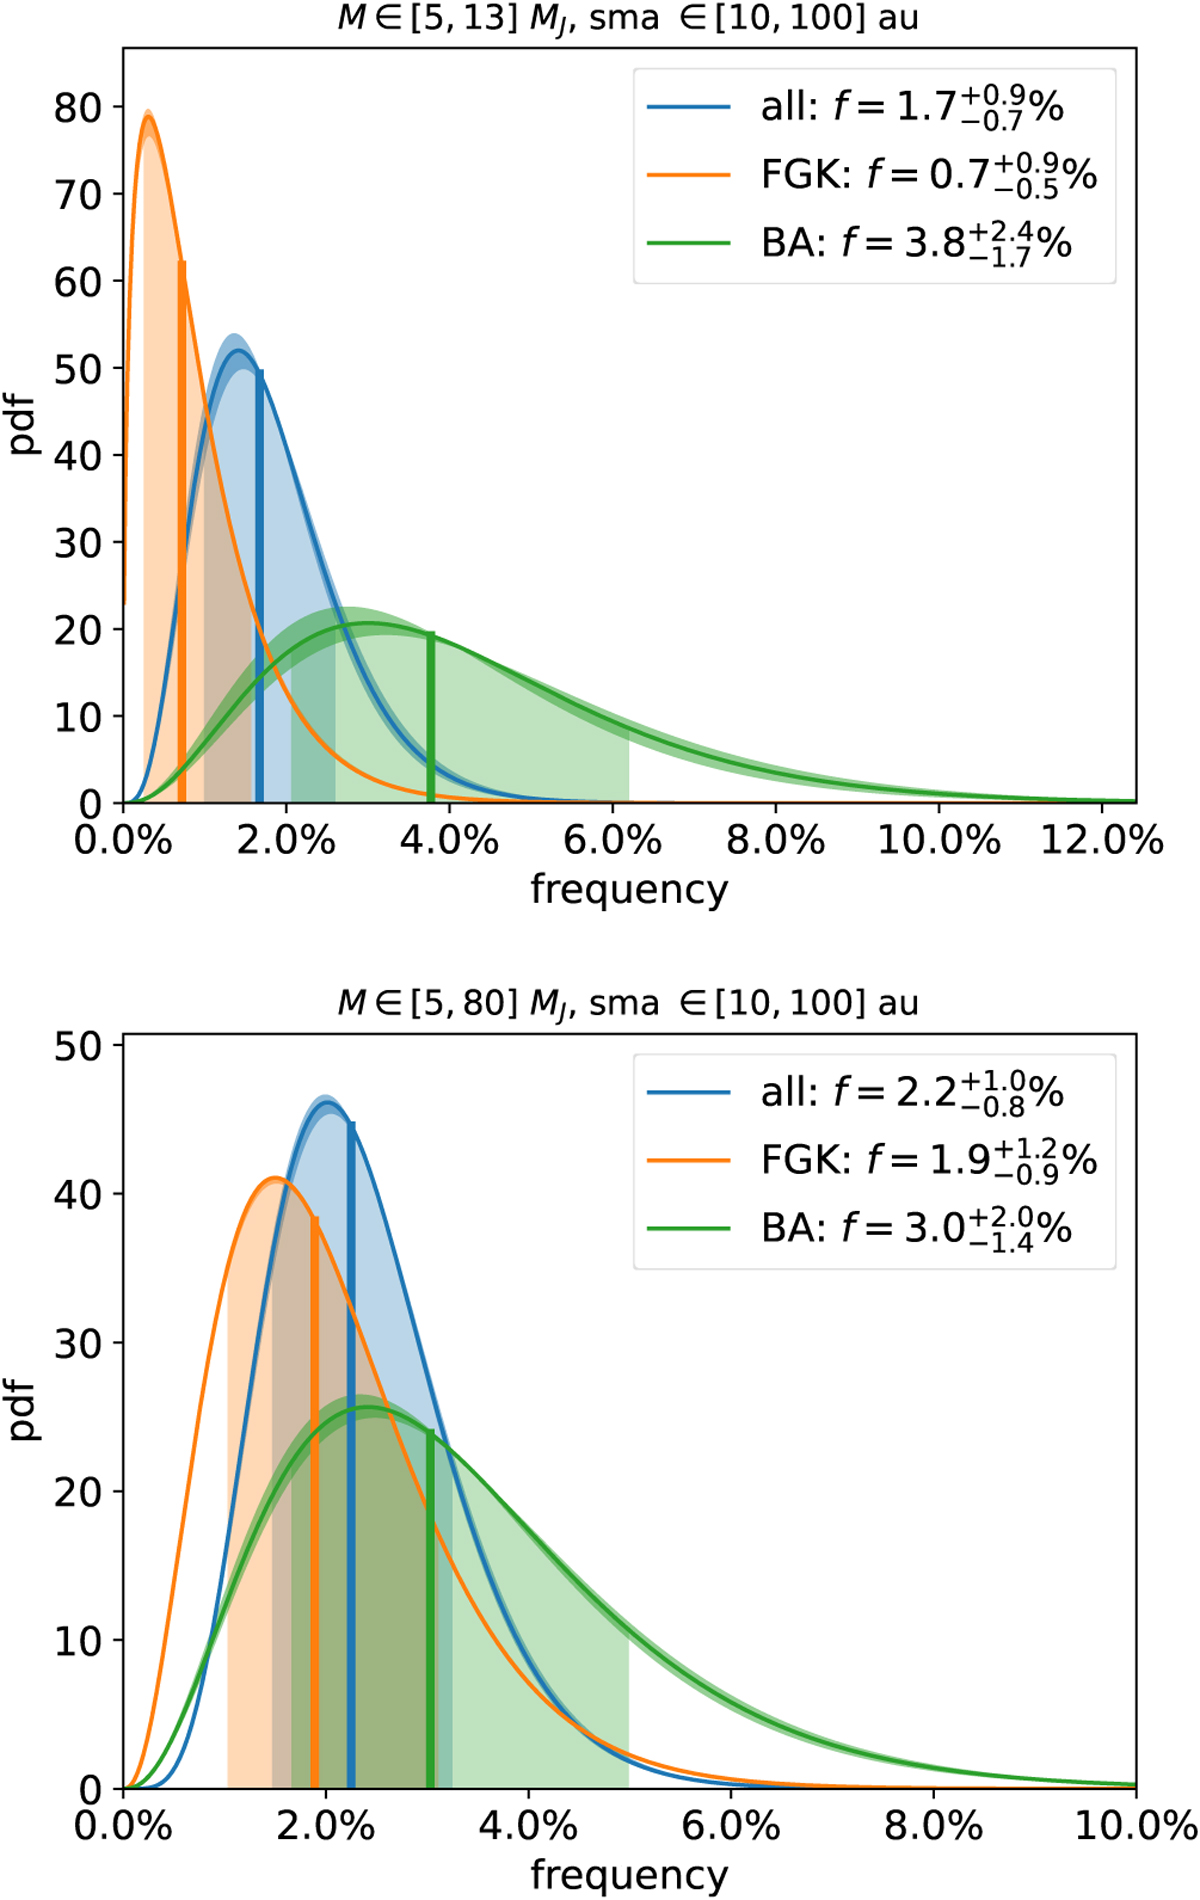
Occurrence frequency of GP (upper panel) and GP+BD (lower panel) from the re-analysis of the 400-star GPIES sample presented in this work. Aggregated results are shown in blue, whereas results for the BA and the FGK subsample are plotted in green and orange, respectively. The colored area encompasses the [16th, 84th] of the posterior distribution.
Current usage metrics show cumulative count of Article Views (full-text article views including HTML views, PDF and ePub downloads, according to the available data) and Abstracts Views on Vision4Press platform.
Data correspond to usage on the plateform after 2015. The current usage metrics is available 48-96 hours after online publication and is updated daily on week days.
Initial download of the metrics may take a while.