Open Access
Fig. 3
Download original image
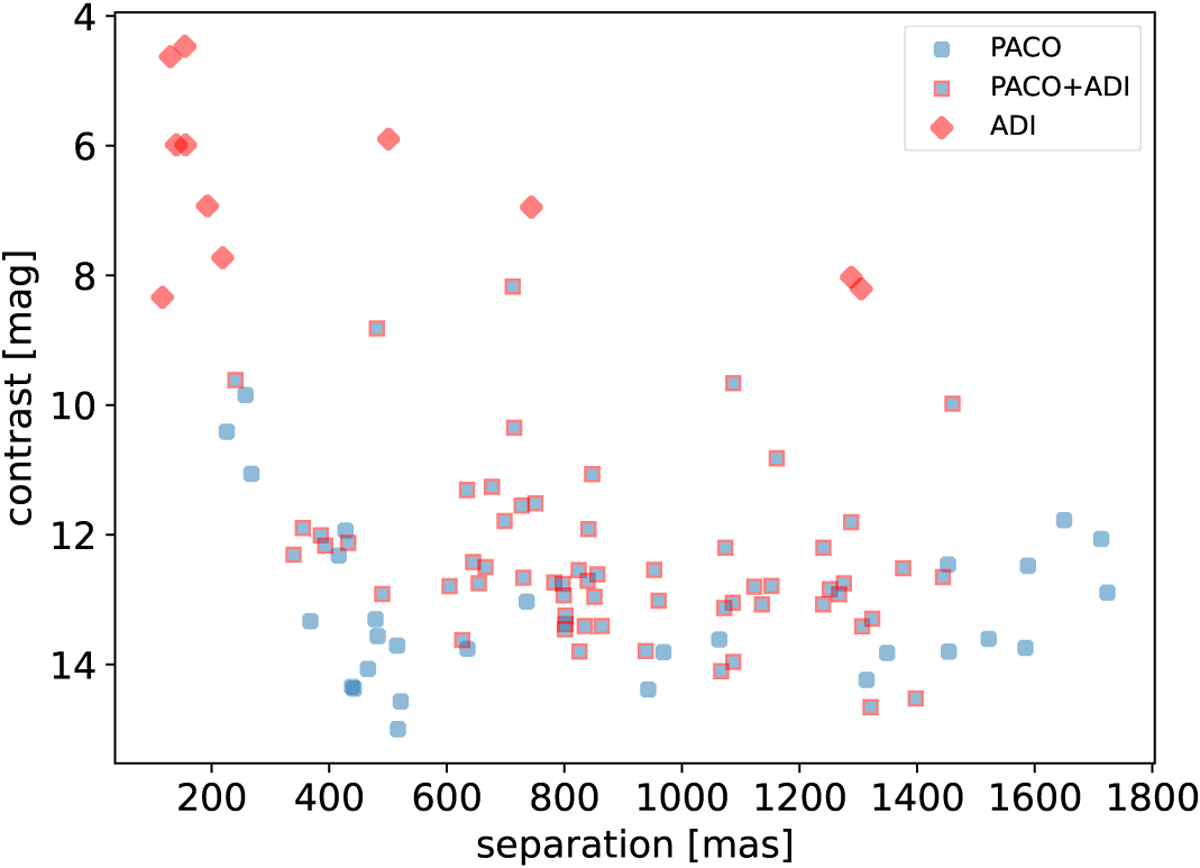
Comparison between PACO and cADI performances. Sources only detected by PACO are shown as blue circles, while sources only seen through cADI are indicated as red diamonds. Common sources are plotted as blue squares with a red edge.
Current usage metrics show cumulative count of Article Views (full-text article views including HTML views, PDF and ePub downloads, according to the available data) and Abstracts Views on Vision4Press platform.
Data correspond to usage on the plateform after 2015. The current usage metrics is available 48-96 hours after online publication and is updated daily on week days.
Initial download of the metrics may take a while.