Fig. 2
Download original image
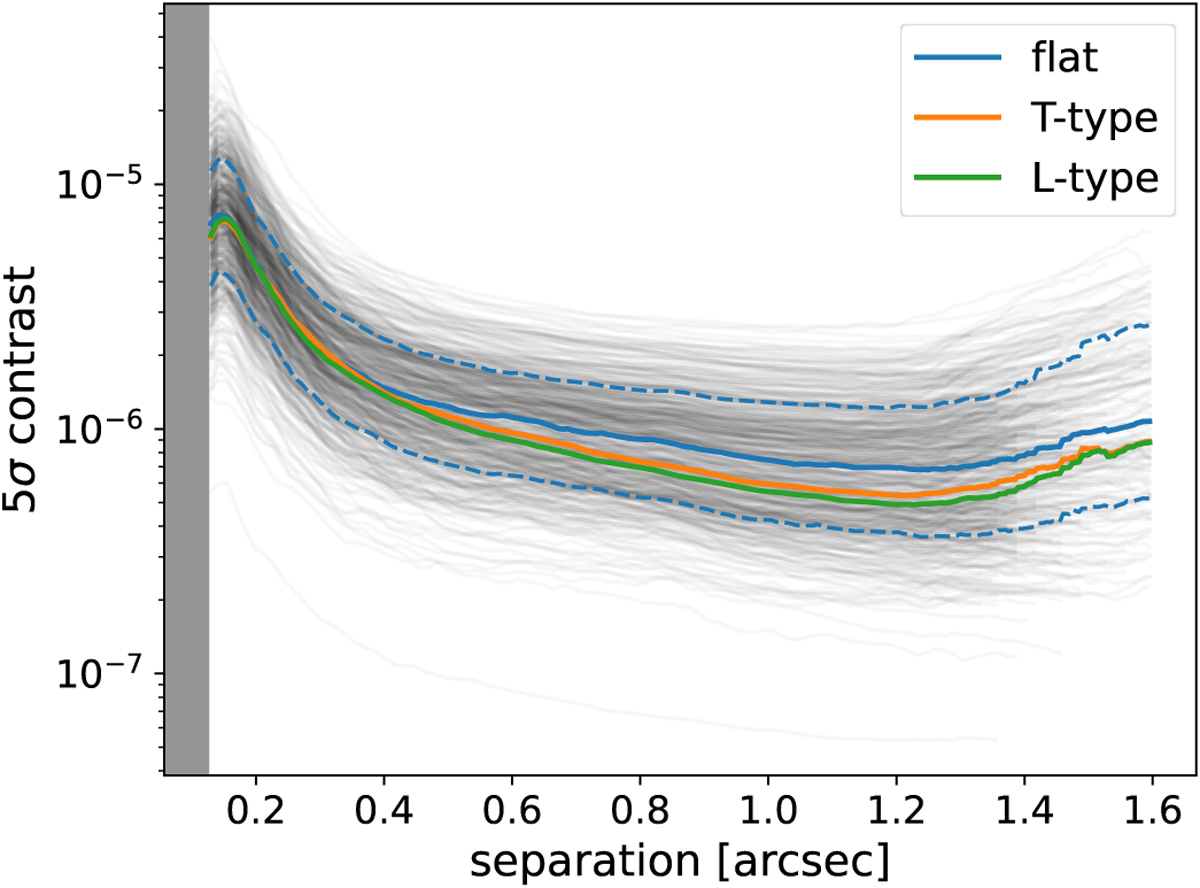
5σ detection limits obtained with PACO. Individual curves are plotted in gray. The median curve is plotted as a light blue solid line, the dashed lines representing the 16 and 84% percentiles of the curve distribution. The orange and green solid lines indicate the median detection limits assuming a T-type and an L-type spectral prior, respectively. The gray box marks the inner working angle of the coronagraphic mask.
Current usage metrics show cumulative count of Article Views (full-text article views including HTML views, PDF and ePub downloads, according to the available data) and Abstracts Views on Vision4Press platform.
Data correspond to usage on the plateform after 2015. The current usage metrics is available 48-96 hours after online publication and is updated daily on week days.
Initial download of the metrics may take a while.