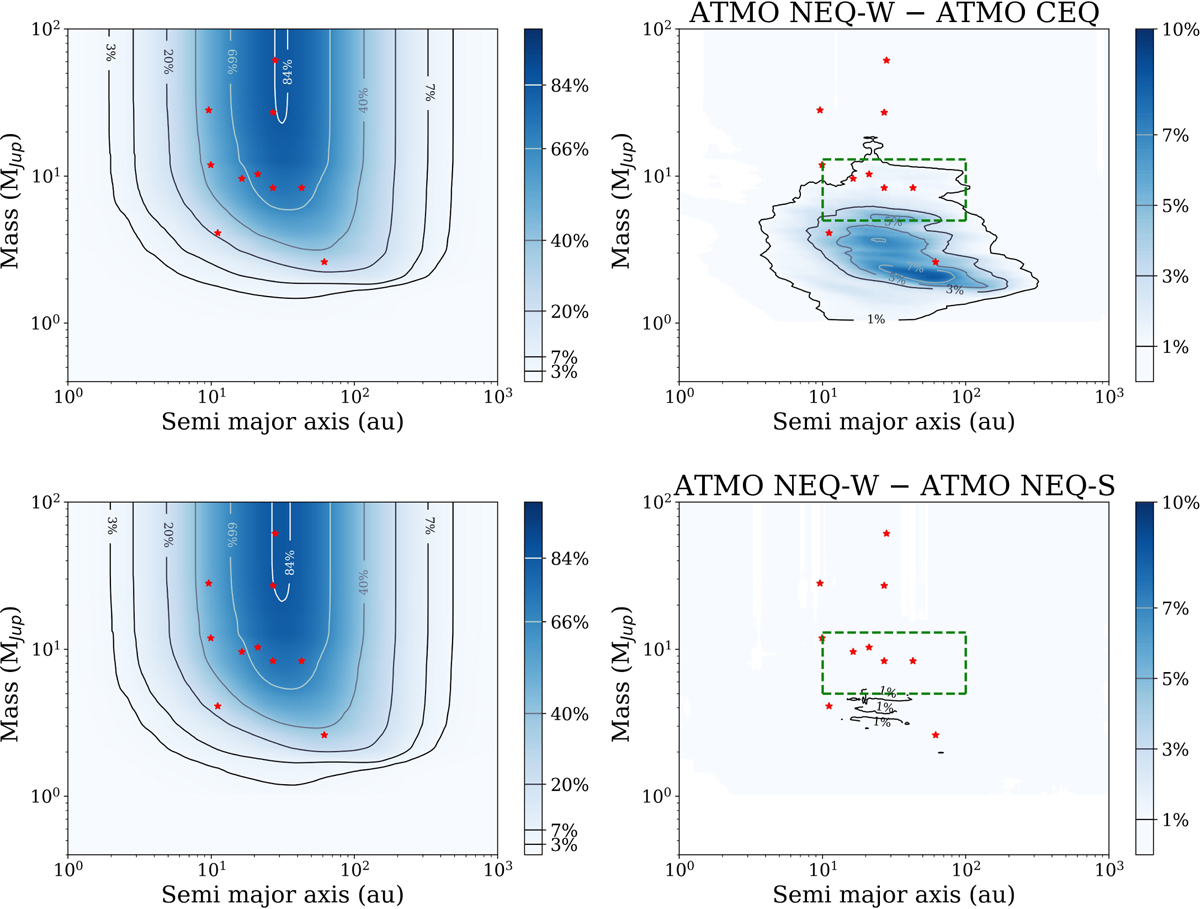
Fig. E.3
Download original image
Effect of non-equilibrium chemistry on survey completeness: maps using the ATMO models assuming equilibrium chemistry (top row) and strong disequilibrium chemistry (bottom row). Left panels show completeness maps, while right panels indicate the difference relative to the map used for the analysis. The green dashed box indicates our nominal choice of 𝒜.
Current usage metrics show cumulative count of Article Views (full-text article views including HTML views, PDF and ePub downloads, according to the available data) and Abstracts Views on Vision4Press platform.
Data correspond to usage on the plateform after 2015. The current usage metrics is available 48-96 hours after online publication and is updated daily on week days.
Initial download of the metrics may take a while.