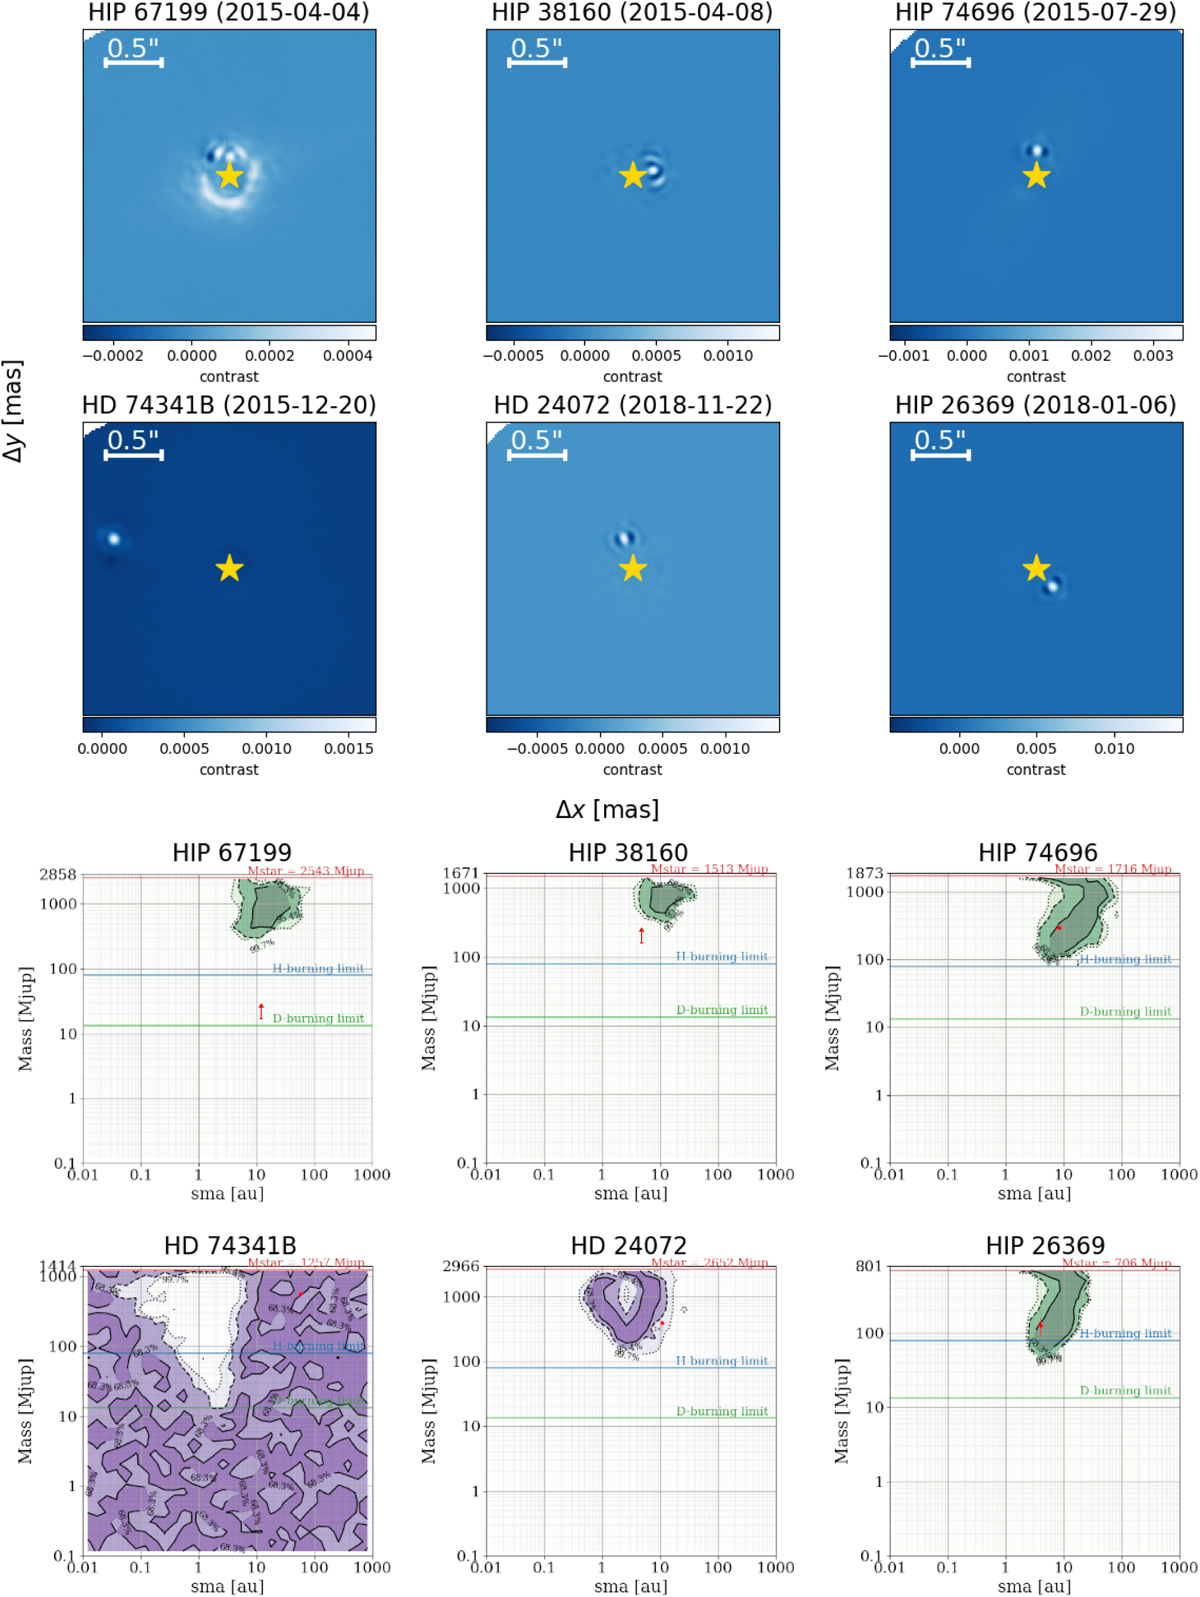
Fig. D.2
Download original image
Upper panel: flux maps (in contrast units) showing the stellar companion candidates detected with cADI. Lower panel: GaiaPMEX (sma, mass) maps, with contours outlining the area corresponding to the 68% and 95% confidence level. Photometric masses (dots) or lower limits (arrows) are overplotted for comparison. The HD 74341B map should be interpreted as a nondetection, the white area being incompatible with the absence of a signal.
Current usage metrics show cumulative count of Article Views (full-text article views including HTML views, PDF and ePub downloads, according to the available data) and Abstracts Views on Vision4Press platform.
Data correspond to usage on the plateform after 2015. The current usage metrics is available 48-96 hours after online publication and is updated daily on week days.
Initial download of the metrics may take a while.