Fig. 10
Download original image
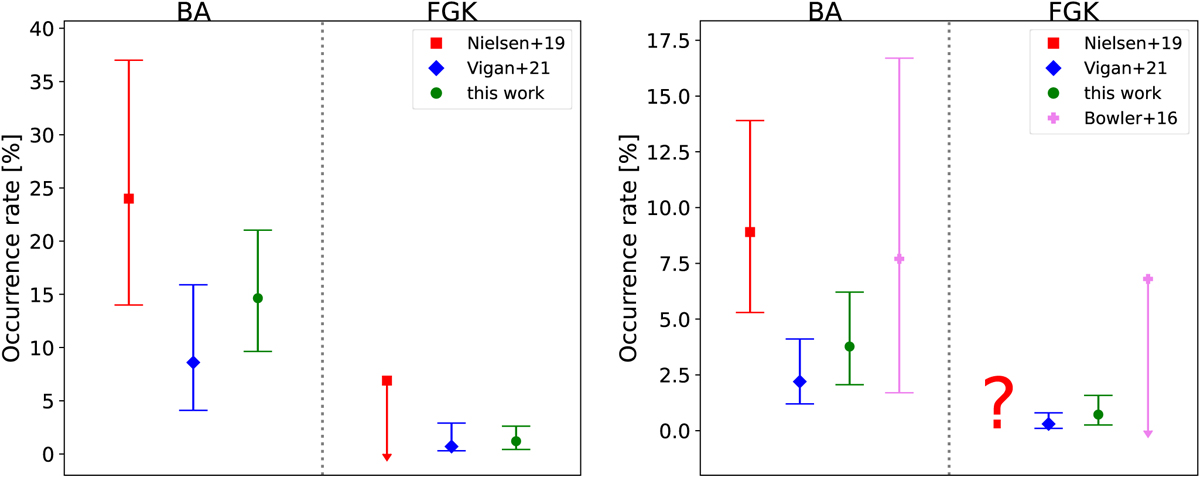
Comparison of the occurrence rates (left panel: 𝒜 = [2,13] MJup × [3,100] au; right panel: 𝒜 = [5,13] MJup × [10,100] au) of giant planets with previous analyses by Bowler (2016), Nielsen et al. (2019) and Vigan et al. (2021). The left and the right half of each panel are relative to BA and FGK stars, respectively. Estimates indicated by arrows are to be read as 95% upper limits, while error bars on point estimates are defined as to encompass the 68% C.I.. Question marks indicate missing data points.
Current usage metrics show cumulative count of Article Views (full-text article views including HTML views, PDF and ePub downloads, according to the available data) and Abstracts Views on Vision4Press platform.
Data correspond to usage on the plateform after 2015. The current usage metrics is available 48-96 hours after online publication and is updated daily on week days.
Initial download of the metrics may take a while.