Fig. 4
Download original image
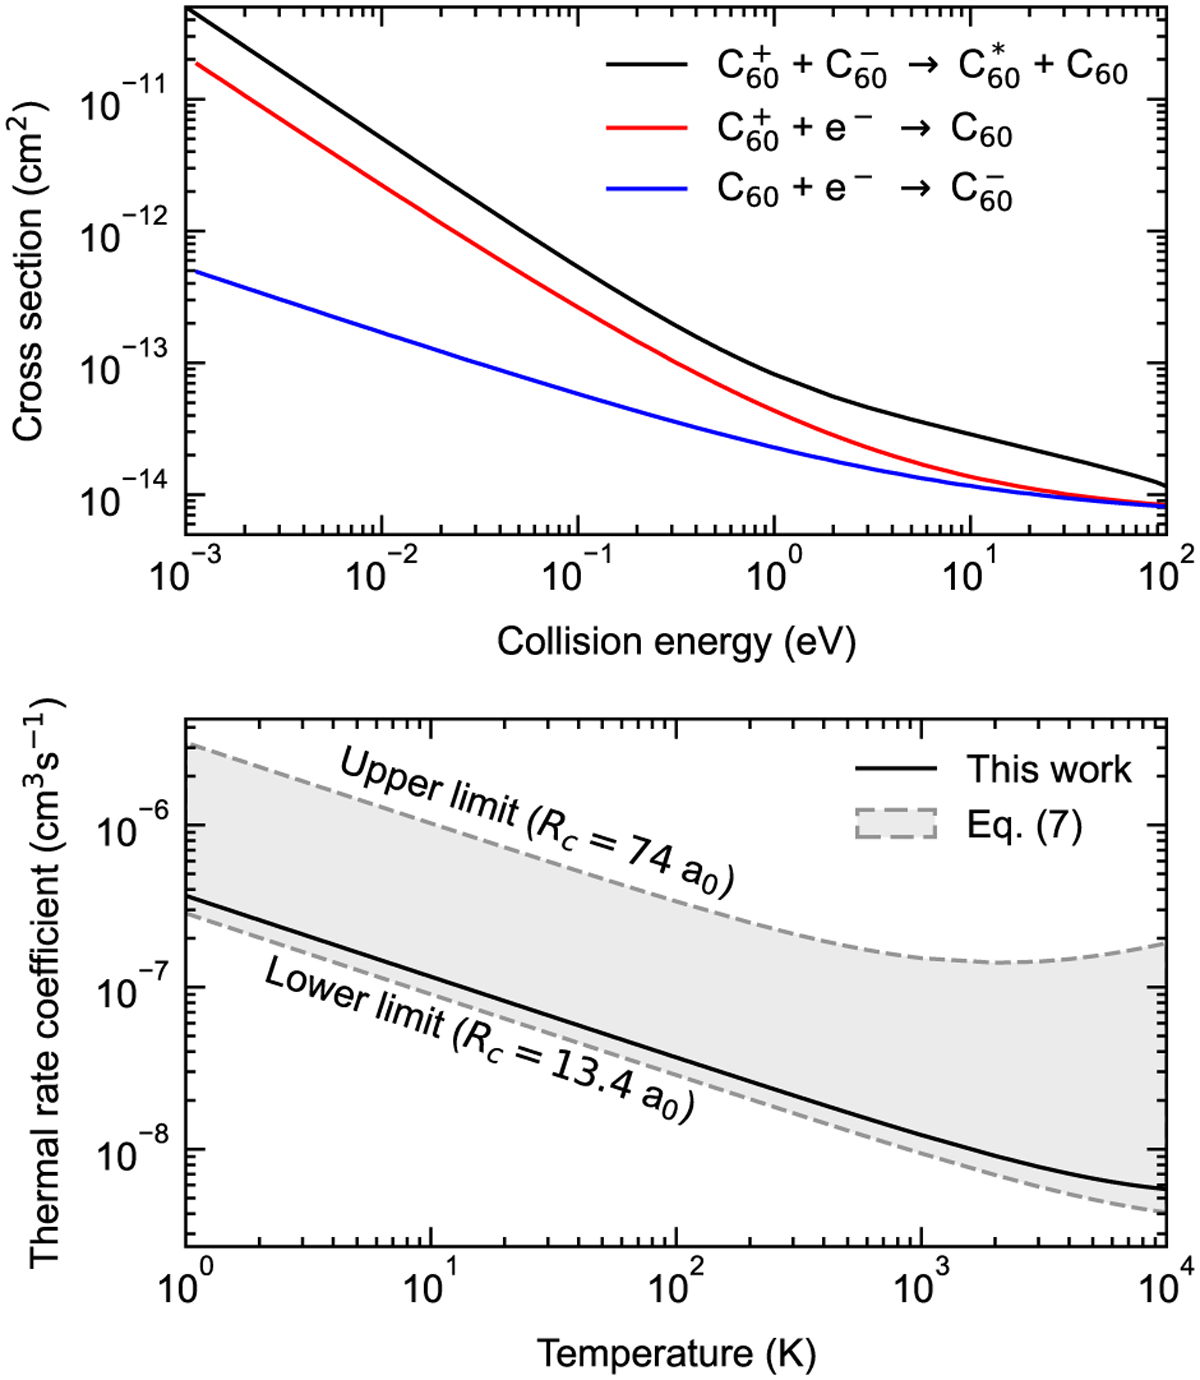
Semi-empirical MN cross section and thermal rate coefficient as functions of center-of-mass collision energy and temperature, respectively. The top panel shows calculated total cross sections for ![]() (black),
(black), ![]() (red), and
(red), and ![]() (blue) reactions. The MN thermal rate coefficient is shown in the bottom panel with the black curve. There, the gray area shows the ranges of MN rates obtained using a simple model developed for the neutralization of dust particles in the interstellar medium (Spitzer 1941), which has previously been used to estimate MN rates involving PAH anions in dense molecular clouds (Wakelam & Herbst 2008).
(blue) reactions. The MN thermal rate coefficient is shown in the bottom panel with the black curve. There, the gray area shows the ranges of MN rates obtained using a simple model developed for the neutralization of dust particles in the interstellar medium (Spitzer 1941), which has previously been used to estimate MN rates involving PAH anions in dense molecular clouds (Wakelam & Herbst 2008).
Current usage metrics show cumulative count of Article Views (full-text article views including HTML views, PDF and ePub downloads, according to the available data) and Abstracts Views on Vision4Press platform.
Data correspond to usage on the plateform after 2015. The current usage metrics is available 48-96 hours after online publication and is updated daily on week days.
Initial download of the metrics may take a while.