Fig. 3
Download original image
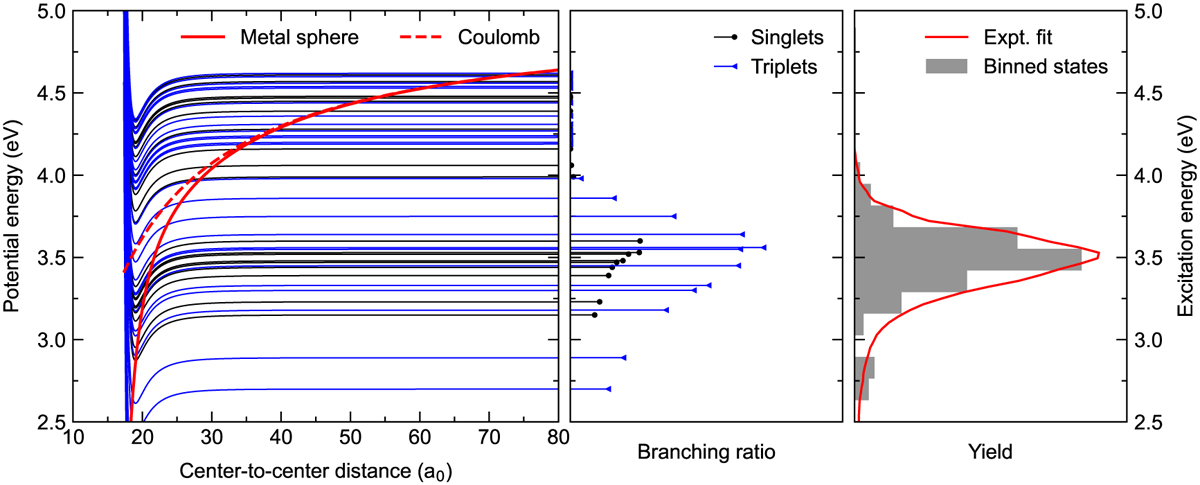
Model potential curves and final state populations. The left panel shows the diabatic potential energy curves used in the present Landau- Zener model calculations. The solid red curve is for the ion-pair state and is a superposition of the interaction energy of two oppositely charged rigid metal spheres and long-range van der Waals interaction, while the dashed red curve shows the interaction energy for oppositely charged point charges. The potentials of the van der Waals states in black (singlet states) and blue (triplet states) are described using the Girifalco potential. These are separated by the excitation energies of C60 at infinite separation, as calculated by means of TD-DFT calculations. The middle panel shows the predicted relative final-state populations from the multichannel Landau-Zener model calculation, which predicts that a broad band of states are populated and is in agreement with the experimental findings. In the right panel, the fitted yield of excitation energies obtained from the experimental fit (red curve) is compared with the binned branching ratios obtained from the modeling.
Current usage metrics show cumulative count of Article Views (full-text article views including HTML views, PDF and ePub downloads, according to the available data) and Abstracts Views on Vision4Press platform.
Data correspond to usage on the plateform after 2015. The current usage metrics is available 48-96 hours after online publication and is updated daily on week days.
Initial download of the metrics may take a while.