Fig. 2
Download original image
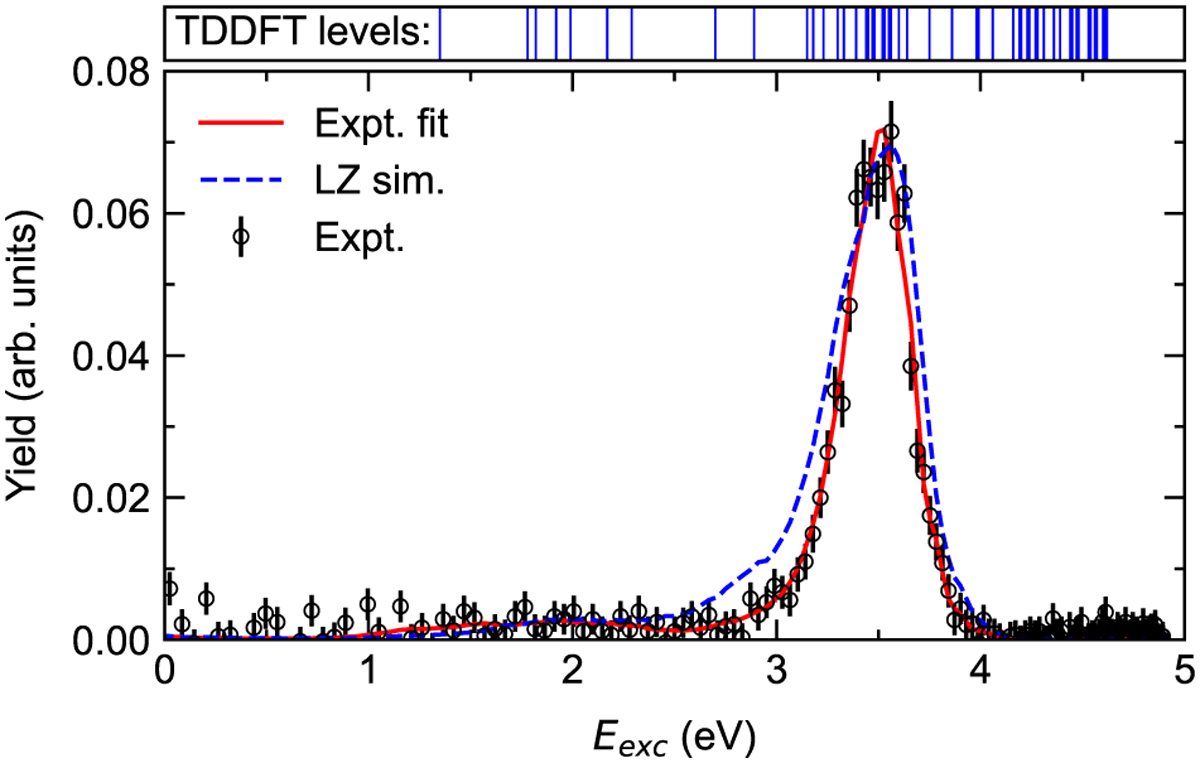
Measured and simulated distributions of the final excitation energies of the two neutral reaction products formed in 100 meV ![]() collisions. The measured Eexc distribution (black circles) reflects the kinetic energy release in the MN process. The blue dashed curve is the simulated result based on input from the present Landau- Zener model calculations when mutual polarization effects and the finite sizes of the collision partners are taken into account. The blue lines in the upper panel display the available final energy levels according to our TD-DFT calculations.
collisions. The measured Eexc distribution (black circles) reflects the kinetic energy release in the MN process. The blue dashed curve is the simulated result based on input from the present Landau- Zener model calculations when mutual polarization effects and the finite sizes of the collision partners are taken into account. The blue lines in the upper panel display the available final energy levels according to our TD-DFT calculations.
Current usage metrics show cumulative count of Article Views (full-text article views including HTML views, PDF and ePub downloads, according to the available data) and Abstracts Views on Vision4Press platform.
Data correspond to usage on the plateform after 2015. The current usage metrics is available 48-96 hours after online publication and is updated daily on week days.
Initial download of the metrics may take a while.